Summary
- A small number of “swing states” effectively decide presidential elections, states that are not overwhelmingly Democratic nor Republican, with a pattern of alternating between the parties in recent presidential elections.
- Taken at face value, swing state polls currently indicate that Biden will win the election.
- But if swing state polls are as wrong in 2020 as they were in 2016 then the 2020 election result will be much closer than recent polls suggest, with a 28.0 per cent chance of a Trump win. If the accuracy of 2020 swing state polls is closer to that seen 2008 and 2012 than in 2016, then the current polls imply only a slim chance of a Trump win, just 4.6 per cent.
- Polls in swing states systematically underestimated Trump’s strength in 2016, with an average underestimate of Trump’s lead over Clinton of 3.7 percentage points across 13 swing states.
- Trump won eight of these 13 states with a poll average picking the wrong winner (Clinton) in five: Florida, Michigan, North Carolina, Pennsylvania and Wisconsin.
- Four of these five states flipped from being Obama wins in 2012 to Trump. Together these five states account for 90 Electoral College votes, more than enough to lead to the incorrect prediction that Clinton would win the presidency. - The polling industry has attempted to understand and remedy the sources of error revealed in 2016 swing state polls. Chief among these sources of error were:
- an unusually large number of undecided voters who broke heavily for Trump in the final week of the campaign;
- failing to anticipate changes in the demographic composition of the 2016 electorate relative to 2008 and 2012;
- college-educated voters were more likely to participate in surveys than voters with lower levels of education, while this latter set of voters turned out at higher levels than in past elections — and supporting Trump — especially in swing states. - Despite a better appreciation of these sources of error and how to eradicate them, state-level polls are likely to vary widely in methodology and quality, as they did in 2016.
- Over and above the vagaries of state polls, forecasts of the November 2020 election outcome ought to be considered especially uncertain, due to the unusual circumstances of the 2020 election, including:
- uncertainty over who will turn out to vote;
- if, how and where early votes and mail votes will be cast;
- the prospect of vote counts being disrupted or disputed.
Introduction
Poll-based election forecasts were widely maligned after the 2016 election, and with some justification: Trump won the election when the bulk of the polling said he would not. Forecasts based on polls performed well in 2008 and 2012, with several analysts (including one of us) correctly picking the winner in all fifty states in 2012. And yet the same methodology — using statistical models to combine poll results — did not fare nearly so well just four years later in 2016. The accurate performance of these methods in 2008 and 2012 led many analysts of 2016 polling data to incorrectly predict Trump would lose.
With polls currently showing Biden handily leading Trump nationally and in many swing states, in this research note we:
- review the current state of 2020 polls;
- remind ourselves of the magnitude of the error associated with poll-based forecasts in 2016;
- ask what went “wrong” with the polls in 2016;
- apply those “lessons learned” to analysis of 2020 election polling.
Swing states decide US presidential elections
US presidential elections are two-stage, state-by-state contests. In 48 of 50 states, the winner of the presidential vote in each state wins that state’s entire Electoral College delegation.1 For the fifth time in American history, the 2016 election produced a mismatch between the “popular” or national vote and the Electoral College outcome.2 In winning a number of key, moderately-sized states by small margins — most notably, Michigan, Wisconsin and Pennsylvania — Trump efficiently converted his 46 per cent of the national vote into 56.5 per cent of electoral votes (EVs) (304 out of 538, with 270 EVs needed to win the presidency). Conversely, Clinton effectively “wasted” some of her 48 per cent of the national vote in winning large states by large margins (e.g., California, New York, Illinois, Massachusetts).
For this reason, election analysts focus less on national polls and more on polls from “swing states”. These are states that have swung between the parties in recent presidential elections (e.g., Michigan, Wisconsin, Pennsylvania, Florida, North Carolina), or could be on the verge of swinging (Arizona, Texas and Georgia on the Republican side, Minnesota on the Democratic side). These states — or even as few as two or three of them — will decide the 2020 election.
2020 polls currently point to a Biden win
The recent history of polls in 11 key states is shown in Figure 1; grey circles are individual polls, the red line is an average of the polls for each state and the lighter, brown line shows the poll average from the corresponding stage of the 2016 election campaign.3 Note we include historically safe Republican states, such as Texas and Georgia, where polls have been pointing to surprisingly strong support for Biden, while omitting Nevada where there have been too few polls for any meaningful poll averaging. The brown lines show poll averages from 2016 at the equivalent stage of the campaign; in many key states Biden leads Trump and by margins greater than the leads Hillary Clinton was recording over Trump in 2016.
Figure 1. Trump trails Biden in many 2020 swing state poll averages
2020 battleground state polls and poll average, from 120 days prior to the election to the present. Each poll result (circle) is represented as Trump’s lead over Biden, with the size of the corresponding circle proportional to the sample size of the poll; negative values indicate polls where Biden led Trump, positive values the opposite. The red line is the trajectory produced by averaging and smoothing the polls, which is updated when new polls are observed. The brown line shows a poll average from each state from the corresponding stage of the 2016 campaign.
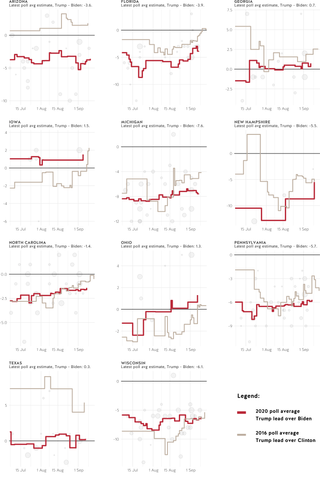
If (a) these states vote as the poll averages currently suggest and (b) other states fall as they did in 2016, then Biden would win the election — and by a comfortable margin — with 334 Electoral College votes to Trump’s 204, a bigger margin than Trump’s 2016 win over Clinton (304-227) and on a par with Obama’s 2012 win over Romney (332-206).
Are pre-election polls accurate?
But how much confidence ought we place in these Biden poll leads? Given the experience of 2016 — where Trump won despite polls indicating the opposite — how ought we temper the interpretation of 2020 polling? We begin by examining the performance of the polls in 2016 and the two previous presidential elections.
Swing state polling performed poorly in 2016, underestimating support for Trump
Poll-based forecasts of the most closely contested, pivotal states were poor in 2016. Figure 2 shows the history of polling in 13 “battleground” states in 2016.
Figure 2. Swing state polls did not perform well in 2016
Swing state polls, poll average and election result, over the final 120 days of the 2016 election campaign. Each poll result (circle) is shown as Trump’s lead over Clinton, with the size of the corresponding circle proportional to the sample size of the poll; negative values indicate polls where Clinton led Trump, positive values the opposite. The red line is the trajectory produced by averaging and smoothing the polls, updated when new polls are observed in the state. The horizontal dark line shows the actual Trump lead over Clinton recorded in the election. The vertical distance between the red line and the horizontal dark line corresponds to the error in forecasting the election result with the poll average. The brown line shows Trump’s estimated lead over Biden using 2020 polls to date.
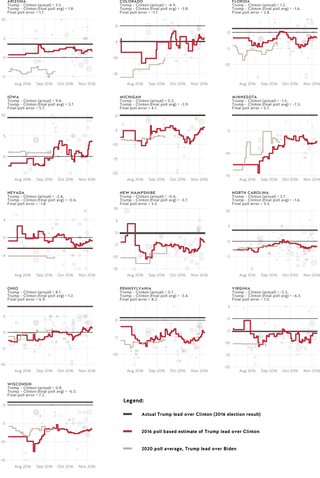
The errors of the final 2016 poll averages are quite large (more than five points) in several cases — underestimating Trump’s strength in each case:
- North Carolina (5.3 points),
- Iowa (5.7 points),
- Minnesota (5.7 points, and almost won by Trump),
- Ohio (6.9 points) and
- Wisconsin (7.2 points).
In only two of 13 states is Trump’s margin over Clinton overestimated: Nevada (by only 1.8 percentage points) and Colorado (1.1 points), and both were correctly predicted as Clinton wins. Of the 11 swing states where the Trump-Clinton margin was under-estimated, Trump won eight, with a poll average picking the wrong winner in five cases: Florida, Michigan, North Carolina, Pennsylvania and Wisconsin. These five states all switched from Obama in 2008 and/or 2012 to Trump in 2016 and together account for 90 Electoral College votes, more than enough to lead to the incorrect prediction that Clinton would win the presidency.
Figure 3. Swing state polling fared better in 2008 and 2012 than in 2016
Errors of poll-based forecasts of the Republican presidential candidate’s lead over the Democratic candidate, in 13 battleground states, over the last 120 days of the campaign, for 2008, 2012 and 2016. Negative values correspond to underestimating the Republican’s lead; positive values correspond to overestimating Republican leads. The daily, average error for these poll-based forecasts (averaged over the 13 states) is shown as the red line.
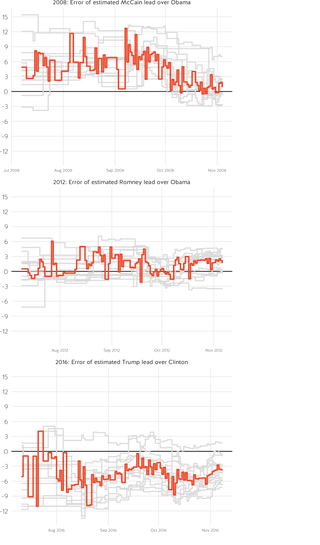
The swing state poll-based forecast errors in 2016 contrast markedly with the corresponding errors from 2012 and 2008, as shown in Figure 3.
The poor performance of swing state polls in 2016 was striking, given that poll-based forecasts in the same states performed well in 2008 and 2012 (see Figure 3). In these previous two elections, poll-based forecasts tended to slightly overestimate the leads of McCain and Romney over Obama, by 0.9 and 1.7 percentage points respectively. In 2016, the election eve poll-based forecast error averaged over 13 states was -3.4 percentage points, underestimating Trump’s margin over Clinton.
Why did state polls perform poorly in 2016?
Since its founding in 1947, the American Association of Public Opinion Research (AAPOR) has been the world’s leading professional association of academic and commercial survey researchers. After the 2016 election AAPOR commissioned an ad hoc committee to examine the performance of election polls. The committee’s report (Kennedy et al. 2018) examined a number of hypotheses about the bias of state-level polls in 2016.
The AAPOR committee found a number of factors contributed to swing state poll error in 2016. We examine the extent to which they could be sources of poll error in 2020.
Voters deciding late
The 2016 election had a large proportion of undecided voters whose late vote choices strongly favoured Trump. According to the AAPOR report, about 13 per cent of voters in Wisconsin, Florida and Pennsylvania decided on their presidential vote choice in the final week of the campaign. Trump won this subset of Wisconsin 2016 voters by nearly 30 points, and by 17 points in Florida and Pennsylvania.4
Figure 4 reports average rates at which survey respondents reported being “unsure”, “undecided” or “don’t know” when asked about their vote choice in 2008, 2012 and 2016, smoothed over time, as well as for 2020 polling observed thus far. This analysis confirms that 2016 had an unusually high level of undecided voters, with an average of 6 per cent of survey respondents (averaging over all national and battleground state polls) reporting they were undecided, even on election eve.
Figure 4. There are very few undecided voters in 2020
Percentage of survey respondents reporting that they are undecided, by year, averaging over states and pollsters and smoothed over time, from 120 days prior to the 2008, 2012, 2016 and 2020 elections through to each respective election day
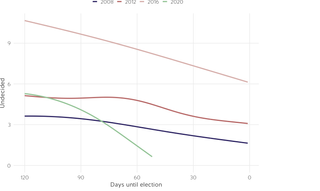
Note however that 2020 polling to date suggests far fewer undecided voters at this stage of the campaign than in the three preceding elections. This finding is consistent with remarkably little variation in President Trump’s approval ratings, which have tracked in a very narrow band from the high 30s to the low 40s, as if opinions were quite fixed about Trump with very few “movable” or “persuadable” voters in the electorate.
These relatively low levels of undecided voters would suggest that this particular source of poll error will not be large in 2020.
Changes in the American electorate
Like Australia, the United States is slowly but steadily becoming more racially and ethnically diverse, such that the demographic composition of the eligible electorate is evolving over time. But with voluntary turnout in the United States, the size and composition of the electorate varies from election to election, sometimes with enormous political consequences. Pre-election polls in the United States must also try to anticipate who will turn out in each election, introducing another source of error when considering polls as election forecasts.
Work by the US Elections Project carefully estimates the racial and ethnic composition of the American electorate. Figure 5 shows that from the mid-1980s to the present, non-Hispanic Whites account for diminishing share of voters turning out in US national elections, ranging from 85 per cent in mid-1980s to about 74 per cent in 2016.
Figure 5. Whites are a diminishing share of the US electorate
Non-Hispanic Whites as percentage of voters in US national elections, 1986-2018. Data from the US Elections Project, http://www.electproject.org/home/voter-turnout/demographics. Solid lines show 1988-2012 trend and 2016 extrapolation for presidential elections and 1986-2014 trend and 2018 extrapolation for midterm elections (authors calculations). The 2018 midterms is the rightmost data point on the graph, which produced century-high midterm turnout and record minority turnout.
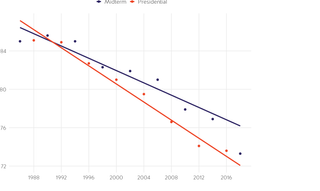
Trend lines show how the 2016 presidential election and the 2018 midterm elections are distinctive. The 2016 election saw only a small fall in the percentage of the electorate that is non-Hispanic white, just half a percentage point from 74.1 per cent (2012) to 73.6 per cent (2016), compared with falls of 2.5 percentage points (2008 to 2012) and 2.9 percentage points (2004 to 2008). Obama’s candidacies help explain this pattern, contrasted with the Trump/Clinton contest in 2016: Obama helped turn out younger voters and minorities who would otherwise have a low propensity to vote. The Trump/Clinton contest generated the opposite effect: a slight, net or relative demobilisation of those voters energised by the earlier Obama candidacies, more than offset by Trump’s mobilisation of white voters who ordinarily have a low propensity to turn out (e.g., non-urban and/or with lower levels of educational attainment).
In no small measure, Trump slowed a longer, historical trend towards Whites becoming a smaller portion of the American electorate. This is not to say minorities and younger voters “stayed home”, at least not in the aggregate. Across the board, voter turnout in the 2016 presidential election was higher than in 2012 (59.2 per cent of the voting eligible population vs 58.0 per cent in 2008) and minorities continued to grow as a proportion of voters. But clearly, the Trump/Clinton contest produced an electorate that was “more white than expected” given longer-term demographic trends and the surge in minority turnout driven by the Obama candidacies.
But while 2016 was unusual with respect to above trend white turnout, Figure 5 also shows how remarkable the 2018 midterm elections were, with not only the highest midterm turnout since 1912 (about 50 per cent, up from 36 per cent in 2014 and 41 per cent in 2010), but historically high minority turnout. In 2018, non-Hispanic Whites as a share of midterm voters fell to levels far below historical trend, even below the 73.6 per cent figure recorded in the 2016 on-year.
This massive boost in turnout in the 2018 midterms speaks to the challenges pollsters face in the 2020 presidential election. If a midterm election — without Trump on the ballot — expanded the midterm electorate by a factor of 20 per cent to 40 per cent, what will turnout look like in 2020 when Trump is on the ballot? If 2018 is anything to go by, turnout will be very high in 2020, or at least will be save for two other factors, further threatening the validity of 2020 polling:
- How will the COVID-19 pandemic dampen what would otherwise be expected to be high voter turnout? The pandemic may prompt some voters to consider not voting in-person on election day and resort to other, more costly forms of voting, such as vote by mail or early voting. The ease of accessing these alternative forms of voting vary tremendously across the United States, at the state and county level, with political consequences which are difficult to anticipate.
- President Trump and Republican supporters have raised doubts about the validity and security of vote-by-mail. Opinion polls show Democrats saying they are far more likely to rely on vote-by-mail this election than Republicans, by margins of 50 points, 70 per cent to 20 per cent. Unsurprisingly, Democrats and other groups are bringing numerous lawsuits to help ensure vote-by-mail remains widely available as a method of voting in 2020. It is quite likely the courts will be asked to adjudicate on the validity of vote results, on the basis that mail ballots have been either improperly included or excluded in official vote tallies.
One well-known forecasting project — FiveThirtyEight — makes some attempt to quantify the uncertainties arising from these factors. At the time of writing (14 September 2020), FiveThirtyEight projects a 6.9 percentage point margin for Biden over Trump in national vote shares, a 329 to 209 Electoral College result and a 75 per cent chance of Biden winning. The fact that a forecast 6.9 percentage point national vote margin translates into just a 75 per cent chance of winning reflects tremendous uncertainty in those projected results, a hedge against the possibility that polls — even if accurate estimates of public opinion — may not correspond to final, legally certified outcomes in November. There is no historical guidance as to how these considerations should temper poll-based forecasts of election outcomes.
Re-interpreting the 2020 polls
The latest state-level, 2020 poll averages imply Biden would win the election with an Electoral College victory of 334 to 204.
We apply three methods for correcting 2020 poll averages in light of the historical information about poll error:
Method 1: direct matching of 2016 poll error onto current 2020 poll averages. That is, for each of 12 battleground states, we look up the error arising from predicting Trump’s margin over Clinton from a poll average computed at the corresponding stage of the 2016 campaign.5 This method is deterministic, a simple “one-shot” piece of arithmetic.
Method 2: sampling from the distribution of poll errors observed in 2016, at this same stage of the campaign, but noting correlations across states. This method deals with the prospect if Trump were to outperform his polls, say, in Pennsylvania, then Trump would be likely to outperform the polls in states which are politically and/or demographically similar to Pennsylvania (e.g., Michigan, Ohio). That is, poll errors are not randomly distributed across states, as indeed 2016 demonstrated.6 This method is probabilistic, producing a range of simulated election outcomes — reflecting the fact 2016 poll errors are unlikely to be replicated exactly. For each simulated election we compute an Electoral College count and then note the proportion of simulated elections where Trump wins; we report this proportion as an estimate of the probability Trump wins a majority of the Electoral College and hence the 2020 election.
Method 3: the same as Method 2, but using the distribution of poll errors observed in 2008, 2012 and 2016. Swing state polls were more accurate in 2008 and 2012 than in 2016. If pollsters have improved their methodology since 2016 then this “blended” distribution of large (2016) and smaller (2008 and 2012) poll errors might be a more realistic approximation to the poll errors likely to be seen in 2020.
Table 1. If 2020 polls are as wrong as they were in 2016, then the election is closer
Latest poll averages in 13 battleground states, corrected by 2016 poll error. The latest poll averages — if translated into election results — would see Biden win the Electoral College 334 to 204. Correcting for the poll errors observed at equivalent stages of the 2016 campaign, the implied Electoral College results become 309 for Biden and 229 for Trump. Shaded rows indicate states where the 2020 predicted result changes after correcting for 2016 poll error.
|
State |
Electoral college votes |
Poll avg last update |
Trump lead |
Poll error at corresponding stage of 2016 campaign |
Trump lead minus 2016 error |
|
Iowa |
6 |
5 September |
1.5 |
-9.8 |
11.3 |
|
Ohio |
18 |
7 September |
1.3 |
-7.7 |
9.0 |
|
Georgia |
16 |
7 September |
0.7 |
-3.2 |
4.0 |
|
Texas |
38 |
7 September |
0.3 |
-3.6 |
3.9 |
|
North Carolina |
15 |
8 September |
-1.4 |
-4.5 |
3.0 |
|
Arizona |
11 |
11 September |
-3.6 |
-1.7 |
-1.9 |
|
Florida |
29 |
8 September |
-3.9 |
-2.1 |
-1.7 |
|
Nevada |
6 |
10 September |
-4.2 |
2.6 |
-6.8 |
|
New Hampshire |
4 |
10 September |
-5.5 |
-5.1 |
-0.4 |
|
Pennsylvania |
20 |
8 September |
-5.7 |
-3.4 |
-2.3 |
|
Wisconsin |
10 |
10 September |
-6.1 |
-7.2 |
1.0 |
|
Michigan |
16 |
8 September |
-7.6 |
-4.4 |
-3.2 |
|
Minnesota |
10 |
10 September |
-7.8 |
-6.8 |
-1.0 |
Method 1 results: Table 1 displays the results of correcting 2020 polls with the poll errors observed at this stage of the 2016 campaign. Poll averages in North Carolina, Wisconsin, and New Hampshire — if they are as wrong as they were in 2016 — are currently picking the wrong winner: Biden, instead of Trump. Under this scenario of replication of 2016 levels of poll error, these states are allocated back to the Trump column and the Electoral College result is 309 for Biden to 229 for Trump.
Method 2 results: This method assumes 2020 poll errors are drawn from the family of poll errors observed in the 2016 election. The resulting distribution of Electoral College outcomes implied by these “error-corrected polls” is summarised in Figure 6. Most of the simulated Electoral College counts for Trump are below the 50 per cent + 1 threshold of 270, but far from all. If poll errors of roughly the same magnitude as seen in 2016 are reproduced in 2020, then current polls should be interpreted as implying Trump has a 34.9 per cent chance of winning the Electoral College and hence being re-elected.
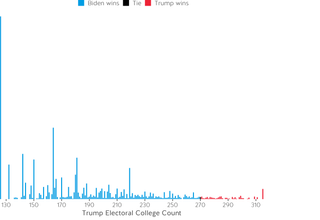
Method 3 results: This method assumes 2020 poll errors are drawn from the family of poll errors observed in 2008, 2012 and 2016, with less underestimation of Trump support than we observed in 2016. Under this set of assumptions, we recover the set of simulated Electoral College counts for Trump shown in Figure 7. Unsurprisingly, if we assume 2020 polls will be more accurate than they were in 2016, then current polling is consistent with a low probability of a Trump win, observed in just 5.3 per cent of the simulated election outcomes.
In short, only if swing states polls are at least as wrong as they were in 2016 can current polling be considered as consistent with a reasonable probability of a Trump win.
Figure 6. Trump has a 28.0 per cent chance of winning if 2020 poll errors look like those from 2016
Distribution of Trump Electoral College Votes, after sampling 5,000 times from distribution of poll errors observed at this stage of the 2016 campaign. Trump wins the Electoral College in 28.0 per cent of these simulated corrections of 2020 swing state polls.
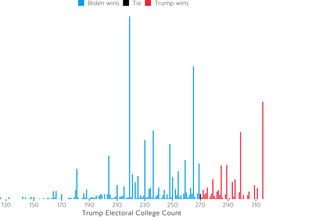
Figure 7. Biden is extremely likely to win if 2020 poll errors follow those seen in 2008, 2012 and 2016
Distribution of Trump Electoral College Votes, after sampling 5,000 times from the distribution of poll errors observed at this stage of the 2008, 2012 and 2016 campaigns. Trump wins the Electoral College in 5.3 per cent of these simulated corrections of 2020 swing state polls.
Conclusion
This analysis should not be construed as finding Trump cannot win the 2020 election. Instead, our goal has been to put the 2020 polls suggesting Trump is likely to lose in some context, with reference to poll errors observed in swing states in recent presidential elections. These errors have been large, but, on balance, insufficient to dispute the conclusion current polls point to a Biden win, but with no more than 65.1 per cent probability.
Moreover, our analysis is based on polls to date, and the relationship between polls at this stage of the campaign and actual election results. There is still more than 50 days to go. Public opinion is unlikely to be static over the balance of the campaign, although we do note the historically low number of survey respondents reporting they are undecided.
Finally, we also stress the prospect that the polls could be accurate reflections of voters’ intentions and still get the 2020 election result wrong. Who will actually vote this cycle — and how — and whether their ballot will be considered legitimate and be counted — is a live and controversial question this election. This too would suggest additional caution in interpreting current polling as an input into any forecast as to who will win the 2020 election.
References
Genz, Alan, Frank Bretz, Tetsuhisa Miwa, Xuefei Mi, Friedrich Leisch, Fabian Scheipl, and Torsten Hothorn. 2020. mvtnorm: Multivariate Normal and T Distributions. https://CRAN.R-project.org/package=mvtnorm.
Jackman, Simon. 2005. “Pooling the Polls Over an Election Campaign.” Australian Journal of Political Science 40 (4): 499–517. https://doi.org/10.1080/10361140500302472.
———. 2009. Bayesian Analysis for the Social Sciences. Hoboken, New Jersey: John Wiley & Sons.
Kennedy, Courtney, Mark Blumenthal, Scott Clement, Joshua D. Clinton, Claire Durand, Charles Franklin, Kyley McGeeney, et al. 2018. “An Evaluation of the 2016 Election Polls in the United States.” Public Opinion Quarterly 82 (1): 1–33. https://doi.org/10.1093/poq/nfx047.
Stan Development Team. 2020. “RStan: The R Interface to Stan.” http://mc-stan.org/.
Venables, W. N., and B. D. Ripley. 2002. Modern Applied Statistics with S. Fourth. New York: Springer. http://www.stats.ox.ac.uk/pub/MASS4/.


