Executive summary
- Australia and the United States have experienced above average levels of economic policy uncertainty in the years since the global financial crisis.
- Increased economic policy uncertainty has been shown to have negative effects on economic activity, employment, trade and investment, while partisan political conflict in the United States has been shown to have negative effects on economy-wide and firm-level investment spending.
- Australian economic policy uncertainty is more strongly correlated with policy uncertainty in the United States than in China or the rest of the world.
- The strong correlation between the Australian, US and global measures of policy uncertainty suggests that uncertainty in the United States has significant international spillover.
- Australian policy uncertainty is more volatile (has a larger standard deviation) than for the United States and globally. This is consistent with Australia’s status as a small, open economy more exposed to foreign shocks than a large and relatively closed economy like the United States.
- Global industrial output declines around 0.5 per cent after six months in response to a one standard deviation increase in global economic policy uncertainty. Global trade volumes decline around 0.8 per cent over the same six months.
- Increased policy uncertainty accounts for some of the slowdown in global trade since the 2008 financial crisis.
- The Australian dollar real exchange rate and real interest rates decline in response to an increase in Australian economic policy uncertainty. However, trade volumes, foreign investment and economic activity do not show statistically significant responses to an economic policy uncertainty shock.
- The Australian economy seems more robust to policy uncertainty than the global or US economy. This has several possible explanations:
- Australia has not experienced a recession during the sample period examined in this report. Uncertainty shocks have been shown to have a bigger impact during recessions in the United States and elsewhere.
- The shock absorbing role played by the Australian dollar foreign exchange rate.
- International influences on the Australian measure of policy uncertainty.
- The Australian media over-stating the implications of foreign economic policy uncertainty for Australia. - In the United States, real interest rates decline, but the exchange rate does not show a statistically significant response to US policy uncertainty shocks. Trade volumes, foreign investment and economic activity all decline in response to an increase in uncertainty.
- The US dollar benefits from safe-haven flows, while US trade and foreign investment is largely denominated in US dollars, reducing the scope for exchange rate adjustments to offset uncertainty or other shocks.
- Increases in partisan political conflict in the United States cause the US dollar real exchange rate to fall, although do not seem to affect foreign trade, foreign investment or economic activity. Other studies have shown a negative effect on US domestic investment spending.
- Given the elevated levels of US economic policy uncertainty, including trade policy uncertainty, and increased partisan political conflict associated with the Trump administration, US and global trade and investment can be expected to be weaker than if the administration followed a more predictable economic policy path at home and abroad.
- An important implication for policy is that reducing policy uncertainty can be expected to benefit cross-border trade and investment, as well as domestic economic activity. Reducing uncertainty requires only that policymakers adhere to well-defined, transparent and rules-based policy frameworks, both domestically and internationally. This can be done at relatively little fiscal cost.
Introduction
Uncertainty about the economy and economic policy in Australia and the United States has increased since the global financial crisis. Australia’s high turnover in prime ministers and US political battles over the budget and debt ceiling have resulted in episodes of increased economic policy uncertainty. In the United States, the election of President Donald Trump has brought a chaotic approach to public administration, particularly in relation to trade policy. Uncertainty about economic policy can reduce economic activity, quite apart from the substance and direct effects of those policies that are actually implemented.
By the same token, reducing uncertainty, for example, by putting in place clear and transparent policy rules and frameworks, can have economic benefits that can be captured at relatively little fiscal cost. Policymakers should aim to reduce uncertainty where possible by increasing the predictability of government policy decisions for business, investors and consumers.
Recent advances in the measurement of economic policy uncertainty has enabled researchers to quantify its effects on the economy.1 Similar methods have been applied to the measurement of partisan political conflict, which is positively correlated with economic policy uncertainty, although not necessarily in a causal fashion.2
Existing research has largely focused on the effects of economic policy uncertainty and partisan political conflict on economic activity, employment and investment. I extend this work to examine the effect of this uncertainty on cross-border trade and investment, with a particular focus on Australia and the United States.
Measuring economic policy uncertainty and partisan political conflict
Economists have long recognised uncertainty as an important influence on economic activity. Following Frank Knight, economists typically distinguish between risks, which are quantifiable based on known probability distributions, and uncertainty, which is generally unquantifiable.3 The actions of policymakers — because they often reflect discretionary decisions rather than following known rules, constitutional or other legal constraints — are an important source of economic uncertainty.
It is necessary to distinguish between general economic uncertainty and economic policy uncertainty. The economy will always have an unpredictable or random component, reflecting factors over which policymakers have little direct control. For example, the weather, natural disasters, technological innovations and other unexpected events can amplify cycles in economic activity. Real business cycle theory (RBC) attempts to explain fluctuations in the economy largely in terms of these real as opposed to monetary or other policy-related shocks.
Economic policy uncertainty concerns the predictability of the actions policymakers take in relation to the policy instruments available to them. Workers, employers, investors and financial market participants try to anticipate how economic policy will affect them and change their behaviour accordingly. If the actions of policymakers are unpredictable, this increases uncertainty and leads the public to take different economic decisions. In particular, consumers may delay spending, or business may defer making investments, waiting for a more certain policy environment.
If the actions of policymakers are unpredictable, this increases uncertainty and leads the public to take different economic decisions. In particular, consumers may delay spending or business may defer making investments.
Scott Baker, Nicholas Bloom and Steven Davis made a significant advance in quantifying economic policy uncertainty with an index that measures this uncertainty over time.4 The index is based on the appearance of keywords in major newspapers relating to economic policy and uncertainty. Their economic policy uncertainty (EPU) index has been constructed for the United States and a number of other countries, including Australia (AUSEPU). There is also a global policy uncertainty (GEPU) index weighted by the size of the constituent economies. A related contribution using a similar methodology by Marina Azzimonti measures partisan political conflict in the United States.5
Increased economic policy uncertainty has been shown to have negative effects on economic activity, employment and investment,6 while partisan political conflict has been shown to have negative effects on economy-wide and firm-level investment spending.7 Economic policy uncertainty has also been shown to negatively affect cross-border trade and investment for the United States.8 Economic policy uncertainty has a larger effect in the context of recessions.9 While these effects are not necessarily surprising, in many cases, they improve our understanding of business cycles in ways not fully captured by other approaches.
In modelling the effects of economic policy uncertainty, it is common to add measures of stock market volatility as a control for general economic uncertainty. Stock market volatility shocks have been shown to have significant macroeconomic effects.10 However, the most commonly used measure of US stock market volatility, the CBOE Volatility Index (VIX),11 does not have an economically or statistically significant correlation with the US Economic Policy Uncertainty Index. This implies that the US EPU Index is capturing policy uncertainty that is independent of general economic conditions. Including the VIX in the models estimated in this report did not significantly change the estimated relationships.
Economic policy uncertainty and investment
Economic policy uncertainty has large effects on investment spending, which is one of the most important influences on fluctuations in overall economic activity. The options theory of investment holds that investment opportunities are analogous to options contracts, where the firm has the option, but not the obligation to invest. The option is valuable until such time as it is exercised. The firm’s investment decision is the optimal time to exercise the option. The option theory of investment gives a major role to uncertainty as a determinant of investment spending. When economic, political and policy uncertainty is high, the value of the option to invest in the future increases, delaying the decision to invest. Ben Bernanke was an early proponent of this approach, in which “events whose long-run implications are uncertain can create an investment cycle by temporarily increasing the returns to waiting for information”.12
Investment spending is also an important influence on international trade, which is dominated by trade in intermediate goods. The effect of uncertainty on investment has a flow-on effect on global trade and helps explain the recent slowdown in global trade in ways traditional models have not been able to accommodate.13
Increased partisan conflict can be expected to increase policy uncertainty and the Azzimonti index of partisan political conflict has a positive correlation of 0.34 with the Baker, Bloom, Davis measure of economic policy uncertainty for the period 1985-2015.14 This correlation is statistically significant, but does not appear to be causal, at least based on statistical tests for causality.15
Economic policy uncertainty in Australia, the United States and the rest of the world
The annotated Global Economic Policy Uncertainty (GEPU) index is shown in Figure 1, highlighting some of the events that give rise to increased uncertainty. There has been an elevated level of policy uncertainty for the global economy in recent years, especially since the election of President Trump in the United States in 2016.
Figure 1: Global Economic Policy Uncertainty Index, January 1997 to June 2018
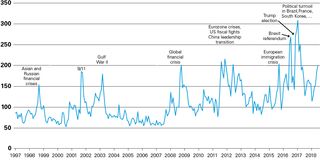
Figure 2 shows the annotated index for Australia. While many of the events shown are international shocks, domestic factors, such as federal elections and changes in prime minister, also give rise to increased uncertainty.
Figure 2: Economic Policy Uncertainty Index for Australia, January 1998 to June 2018
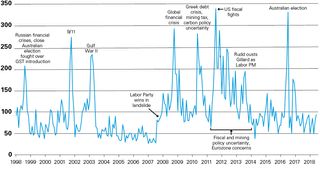
Figure 3 shows the Economic Policy Uncertainty (EPU) index for Australia, the United States and globally as a log-level deviation from a filtered trend, so the vertical axis can be multiplied by 100 and interpreted as a percentage deviation.16 This is the same form in which the data enter the models estimated below. The original data can be found at the Economic Policy Uncertainty website.17 This filtering method is standard in the literature, although subject to well-known criticisms. In particular, it may result in spurious cycles and other forms of bias, but has important offsetting advantages in estimating statistical and economic relationships with other data.18 It should also be noted that the uncertainty measures for different countries are not strictly comparable in that they are derived using somewhat different methodologies, reflecting the sources available in each country, but these differences are unlikely to be significant for our purposes.
Figure 3: Economic Policy Uncertainty, deviation from trend, Q1 1985 to Q1 2018
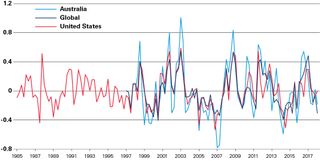
The strong correlation between the United States, global and Australian measures suggests that US policy uncertainty has significant international spillover. Policy uncertainty abroad increases uncertainty in Australia. This is particularly apparent from the response of these measures to the global financial crisis of 2008-09. Australian policy uncertainty is notable for being more volatile (has a larger standard deviation) than for the United States and globally, which is consistent with Australia’s status as a small, open economy with a relatively large traded goods sector that leaves it more exposed to foreign shocks than a large and relatively closed economy like the United States. The standard deviation for the Australian measure is 58.6 versus 45 for the United States and 46 for the global measure, based on a balanced sample.
The correlation coefficients between the Australian EPU measure and those for selected other countries are shown in Table 1.
Table 1: Correlation coefficients between Australian and selected foreign Economic Policy Uncertainty indexes, balanced sample, January 1998 — May 2018
|
Correlation |
Australia |
Global |
United States |
Canada |
Europe |
China |
|
Australia |
1.000000 |
|||||
|
Global |
0.639756 |
1.000000 |
||||
|
United States |
0.701452 |
0.772772 |
1.000000 |
|||
|
Canada |
0.555999 |
0.829967 |
0.682835 |
1.000000 |
||
|
Europe |
0.616246 |
0.903930 |
0.693124 |
0.803893 |
1.000000 |
|
|
China |
0.386819 |
0.900427 |
0.509943 |
0.699675 |
0.751921 |
1.000000 |
It is notable that the strongest correlation for Australian EPU is with the United States. This is not simply a function of the size of the US economy, but a measure of the strength of the economic relationship between the two economies. The correlation between the Australia and China measures is only 0.39. Every individual economy in the table is less strongly correlated with the United States and more strongly correlated with China than is Australia. Even Canada is not as strongly correlated with the United States as Australia.
While it would be desirable to distinguish between foreign and domestic uncertainty shocks and their economic effects, the strong correlation suggests that it is difficult to separate them. Although it is possible to take a spread between the foreign and Australian measures, this might only capture Australia’s greater exposure to foreign shocks rather than serving to identify the purely domestic component to economic policy uncertainty. Explicitly controlling for foreign economic policy uncertainty shocks would leave little role for the domestic uncertainty measure given that much of the economic policy uncertainty in Australia is a response to international events. However, the global measure of economic policy uncertainty does not suffer from potential mismeasurement due to international spillover, which may explain why the global model estimated below yields relatively robust results.
The Baker, Bloom, Davis index can be broken down into different categories of policy, including trade policy. The trade policy component has been particularly elevated under President Trump, with some of the highest readings since the US Congressional vote on the North American Free Trade Agreement in November 1993 (Figure 4). This component has been shown to have a negative effect on cross-border trade and investment for the United States.19
Figure 4: Trade Policy Uncertainty, January 1985 to July 2018

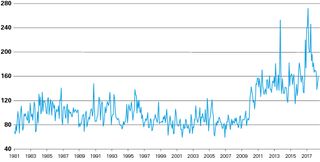
The Partisan Political Conflict Index is shown in Figure 5. The index takes a step-up from 2011 due to congressional battles over the US budget and debt ceiling, and again around the time of the 2016 presidential election in the United States. Increased partisan political conflict has been shown to have a negative effect on US private investment spending at the firm and economy-wide level.20
Figure 5: Partisan Political Conflict Index, January 1981 to June 2018, average of 1990 equals 100
Global economic policy uncertainty, industrial production and trade
The GEPU Index is a GDP-weighted average of national EPU indices for 19 countries: Australia, Brazil, Canada, Chile, China, France, Germany, India, Ireland, Italy, Japan, Mexico, the Netherlands, Russia, South Korea, Spain, Sweden, the United Kingdom, and the United States. The global measure (gepu) can be examined in the context of a model that relates it to monthly global industrial production (gip), global trade volumes (gtv) and real commodity prices (commod).21 Global IP proxies for global demand shocks, while real commodity prices proxy for global supply shocks.
The modelling approach is one that assumes that each of these variables depends on the other variables in the system, with a lag.22 The effects of shocks (defined as a one standard deviation increase) to one variable can then be shown for the other variables in the system. The variables are ordered so that some are determined by variables higher up in the system, but not those lower down, which allows a causal interpretation to be given to the effects of shocks to each. The causal ordering runs from global economic policy uncertainty, to real commodity prices, to global IP and then global trade volumes.23 The sample period is March 2001 to April 2018 and is determined by the availability of the monthly data on global IP and trade volumes.
Figure 6 shows the effect (solid line) of an increase in global economic policy uncertainty on global IP and global trade volumes over a 48-month period. The dashed lines are standard error bands, a measure of statistical confidence about the magnitude of the effect. If the standard error bands take in zero, then the estimated response shown by the solid line is not statistically different from zero.
Figure 6: Responses of Global Industrial Production (GIP) and Global Trade Volumes (GTV) to Global Economic Policy Uncertainty (GEPU) shock
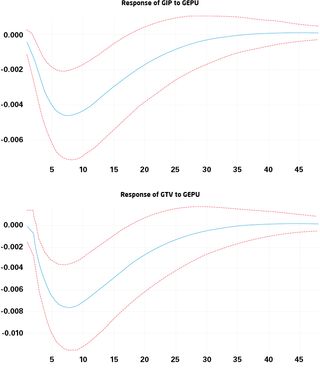
Global industrial production declines around 0.5 per cent after six months in response to a one standard deviation global economic policy uncertainty shock. Global trade volumes decline around 0.8 per cent over the same period. This is consistent with the observation that global trade is typically more volatile than economic activity more broadly, with much of that trade being in intermediate goods trade tied to cyclically-sensitive investment spending. These results are consistent with what other research has found in terms of the effect of economic policy uncertainty on domestic investment spending. Around 32 per cent of the variance in global trade volumes can be explained with reference to global economic policy uncertainty after 12 months. Economic policy uncertainty is an important influence on global trade volumes, even accounting for global demand and supply shocks.
The global index is a weighted average of national measures and it is ultimately up to individual countries to reduce policy uncertainty. However, we have seen that economic policy uncertainty can have international spillover, as suggested by the strong correlation between the Australian, US and global measures. Reducing policy uncertainty in one country is likely to have spillover benefits for other economies via trade and international capital market linkages.
Australian economic policy uncertainty, trade and foreign investment
The Australian measure of economic policy uncertainty (ausepu) is examined for its effects on trade volumes, foreign direct and foreign portfolio investment. The same modelling framework is applied as for the global measure in the previous section. The other variables used in the system include the Australian dollar real effective exchange rate (audreer), the real three-year bond yield (audr), and gross national expenditure (gne), a measure of economic activity that abstracts from imports and exports that is often used as an ‘absorption’ variable in open economy modelling. Variables enter the model as deviations from filtered trends. The causal ordering is from economic policy uncertainty, to the real exchange rate, real interest rates, trade volumes and cross-border investment, and finally GNE. Portfolio investment is ordered before foreign direct investment.
Foreign investment components are measured based on real transactions that abstract from valuation and price effects such as exchange rate movements. The stock of foreign investment at the end of Q3 1988 is taken as the starting value and subsequent transactions are added to this value to derive a real series for the stock of foreign investment.24
The system is estimated using quarterly data from the September quarter 1998 to the December quarter 2017, with the sample period determined by the availability of the Australian measure for economic policy uncertainty. A two quarter lag is used based on model selection criteria.
Policy uncertainty shocks, Australian trade volumes and inward foreign investment
Figure 7 shows the response of Australian trade volumes (atv), that is, the sum of real imports and exports, inward foreign direct investment (aufdi) and inward portfolio investment (auport) to Australian economic policy uncertainty shocks over 16 quarters, along with the other variables in the system.
Figure 7: Responses of selected Australian variables to an Australian Economic Policy Uncertainty shock
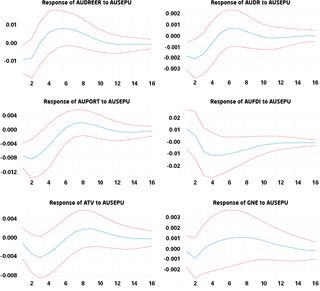
The real effective exchange rate declines around 1 per cent in the first quarter following a policy uncertainty shock, while real interest rates fall around 20 basis points after two quarters (the change in the nominal exchange rate and interest rate could be expected to be larger). Trade volumes decline around 0.4 per cent after three quarters (imports and exports show quantitatively similar responses if included separately). Foreign portfolio investment declines 0.8 per cent after three quarters, while inward FDI declines around 1 per cent after four quarters. GNE shows a negligible response.
The standard error bands imply that only the responses of the exchange rate, real interest rate and portfolio investment are statistically different from zero. This is an encouraging result in that it suggests that financial market prices and portfolio investment flows carry the burden of adjustment to policy uncertainty shocks.
Policy uncertainty shocks, Australian trade volumes and outward foreign investment
I also consider how Australian economic policy uncertainty shocks affect Australian direct investment abroad (aufdia) and portfolio investment abroad (auporta) by substituting outward for inward investment in the above model. It is desirable to do this in a separately estimated model given that inward and outward foreign investment need not be mutually dependent and in order to reduce the number of parameters that need to be estimated in any one model. The responses are shown in Figure 8.
Figure 8: Responses of selected Australian variables to an Australian Economic Policy Uncertainty shock
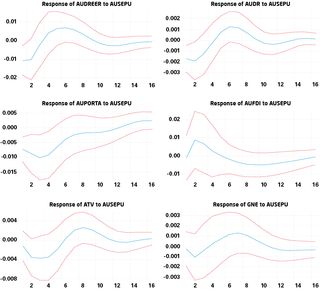
Outward portfolio investment decreases by 1 per cent in response to an Australian policy uncertainty shock after three quarters. This might be thought to be encouraging in suggesting that rather than domestic capital fleeing domestic policy uncertainty, portfolio investment abroad actually declines. However, this likely reflects foreign influences on domestic policy uncertainty. Portfolio investment abroad decreases because of an increase in foreign economic policy uncertainty captured by the Australian measure. While direct investment abroad increases by around 1 per cent after two quarters, which is more consistent with Australian capital flight abroad, this result is not statistically significant. Again, financial markets and portfolio flows seem to carry the burden of adjustment to uncertainty shocks.
These results are consistent with the conventional wisdom that the floating of the Australian dollar and the deregulation of Australian capital markets in the 1980s has increased the resilience of the Australian economy. It is also consistent with the Australian economy being relatively robust to policy uncertainty considering the apparent sensitivity of global trade to policy uncertainty found earlier. However, this conclusion is subject to the caution that the Australian economy has not experienced a recession during the sample period covered by the model. Researchers have found that US economic policy uncertainty has more pronounced effects in the context of an economic downturn.25 The Australian index may also be picking up foreign influences that are less relevant to the Australian economy. It might also be consistent with the Australian media over-stating the importance of foreign economic policy uncertainty for the Australian economy, so the Australian index mismeasures the economically-relevant component of policy uncertainty for Australia. The greater volatility of the Australian measure compared to the United States or global measures may reflect this mismeasurement.
US economic policy uncertainty, trade and foreign investment
The US measure of economic policy uncertainty (epu) is examined for its effects on trade volumes (ustv), foreign direct investment in the United States (usfdi) and foreign portfolio investment in the United States (usport). The other variables used in the system include the US dollar real effective exchange rate (usdreer), the real three-year bond yield (usdr), and gross domestic product (gdp). Variables enter the model as deviations from filtered trends. The causal ordering is from economic policy uncertainty, to the real exchange rate, real interest rates, trade volumes, foreign portfolio and direct investment and finally GDP. Unlike the Australian data, the US data on foreign investment are based on stocks unadjusted for exchange rate and price effects. The effect of economic policy uncertainty on US foreign investment may reflect nominal rather than real influences.
The sample period for the US model is from the third quarter 2006 to the fourth quarter of 2017, with the availability of quarterly foreign investment data determining the sample period.
Policy uncertainty shocks, US trade volumes and inward foreign investment
The responses to US economic policy uncertainty shocks are shown in Figure 9.
Figure 9: Responses of selected US variables to a US Economic Policy Uncertainty shock
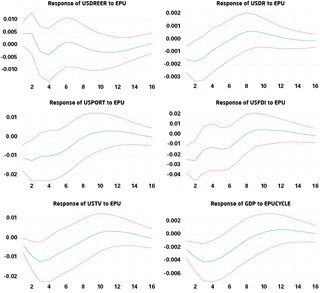
The US dollar real exchange rate is notable for initially rising in response to a policy uncertainty shock, although this result is not statistically different from zero. This may reflect competing influences on the exchange rate in response to uncertainty shocks. To the extent that the shock has an international component, the US dollar exchange rate might benefit from safe-haven capital inflows, which limits the ability of the exchange rate to act as a shock absorber. US trade and investment flows are in any case largely denominated in US dollars, which limits the usefulness of any exchange rate adjustment.
Real interest rates decline around 20 basis points, which is a similar magnitude to that found for Australia. Foreign portfolio inflows decline around 1.2 per cent after three quarters, while FDI inflows decline around 2.6 per cent over the same period. Trade volumes decline around 1.2 per cent after three quarters, while GDP declines around 0.4 per cent over the same period.
US trade, cross-border investment and economic activity shows a more pronounced response to economic policy uncertainty shocks than is the case in Australia, perhaps reflecting a more limited role for the exchange rate as an adjustment mechanism.
Overall, US trade, cross-border investment and economic activity shows a more pronounced response to economic policy uncertainty shocks than is the case in Australia, perhaps reflecting a more limited role for the exchange rate as an adjustment mechanism. The US economy experienced a severe downturn during the sample period, which increased the economic importance of policy uncertainty.26 Monetary policy has been shown to be less effective for a given policy change in the context of an economic downturn and in the presence of increased uncertainty.27 This does not mean that monetary policy is ineffective, but it does mean that monetary policy needs to be used more aggressively in the presence of increased economic and economic policy uncertainty. It is likely the United States failed to use monetary policy as aggressively as it could have during the most recent recession due to mistaken beliefs about the zero lower bound as a constraint on policy. The fact that the Federal Reserve has presided over an undershooting of its inflation target in recent years implies that monetary policy has been tighter than policymakers intended.
Policy uncertainty shocks, US trade volumes and outward foreign investment
As with Australia, it is worth considering the effects of economic policy uncertainty on US outward foreign investment, by substituting US direct investment abroad (usdia) and portfolio investment abroad (usporta) for their inward counterparts (Figure 10).
Figure 10: Responses of selected US variables to US Economic Policy Uncertainty shock
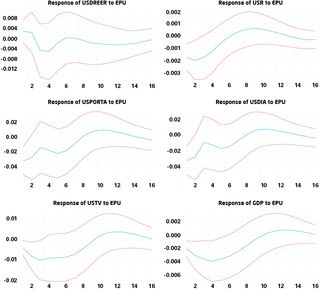
US portfolio and direct investment abroad both decrease by around 3 per cent in response to a policy uncertainty shock. US capital does not seem to flee abroad in response to domestic policy uncertainty, although this may indicate heightened risk aversion making investors more cautious, international spillover from US policy uncertainty, or the US measure capturing foreign uncertainty shocks. The other responses are otherwise similar to those shown for the model with inward rather than outward investment.
US partisan political conflict
The Partisan Political Conflict Index can be substituted for the Economic Policy Uncertainty Index in the previous model for the United States to determine the effects of partisanship shocks. The responses are shown in Figure 11. As noted previously, I do not find a causal relationship between the US economic policy uncertainty and partisan conflict indices that would warrant also including economic policy uncertainty in the model.
Figure 11: Responses of selected US variables to Partisan Political Conflict shock
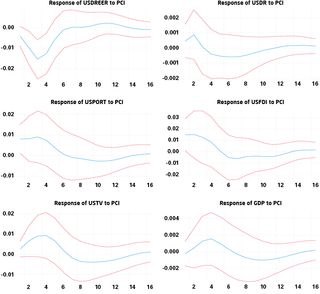
The US dollar exchange rate declines 1.5 per cent after three quarters in response to a partisanship shock, suggesting that political partisanship undermines the US dollar’s safe-haven appeal. Shocks to US political partisanship are more likely to reflect purely domestic factors than economic policy uncertainty. Remarkably, foreign investment in the United States seems to increase in response to a partisanship shock. Outward investment also increases (not shown here). This may reflect the role of the exchange rate in cheapening US assets in response to a partisanship shock, so the exchange rate plays more of a shock-absorbing role, although the standard error bands do not suggest much confidence in the magnitude of this effect. Overall, US cross-border trade and investment and economic growth would appear to be robust to political partisanship shocks, although there may be long-run effects from partisanship shocks the model is not able to capture.
Conclusions and recommendations
Global industrial production and global trade volumes both decline in response to increased global economic policy uncertainty. In particular, a one standard deviation increase in global policy uncertainty reduces global trade by 0.8 per cent after six months. By the same token, reducing policy uncertainty could be expected to increase global trade by the same magnitude.
Australia’s economy and cross-border trade and investment seem to be more resilient to economic policy uncertainty shocks than global or US production and trade. In part, this reflects the role of Australia’s floating exchange rate and portfolio investment flows in carrying the burden of adjustment to policy uncertainty shocks. It also reflects the absence of a conventionally-defined recession in Australia during the sample period considered in this report. The experience of the United States suggests the Australian economy could be less resilient to uncertainty shocks in the context of a future economic downturn.
Australian economic policy uncertainty is more volatile than in the United States, reflecting Australia’s status as a small, open economy with a large traded goods sector that is necessarily exposed to foreign shocks. The strong correlation with foreign measures suggests the Australian uncertainty measure is capturing global uncertainty that may not always be relevant to the Australian economy. Foreign shocks are filtered through Australia’s floating exchange rate, which may lessen their impact. The Australian media may also be over-stating the importance of foreign uncertainty for domestic uncertainty. It is also noteworthy that Australian policy uncertainty is more strongly correlated with the United States than other major economies, including China.
The United States does not benefit from the exchange rate shock absorber to the same degree as Australia. Policy uncertainty may lead to safe-haven flows into the US dollar, particularly where uncertainty shocks have international spillover. US trade and investment flows are largely denominated in US dollars, limiting the benefit of any exchange rate adjustment for the US economy. US trade volumes, cross-border investment and GDP are all negatively affected by increased policy uncertainty.
By supporting a rules-based political and economic order both at home and abroad, Australian policymakers can mitigate — even if they cannot entirely eliminate — the negative economic implications of foreign and domestic policy uncertainty shocks.
Increased partisan political conflict lowers the US dollar real effective exchange rate, but does not seem to impact trade volumes, cross-border investment or GDP in a statistically significant way. As a more specifically US phenomenon, increased partisan political conflict may undermine the safe-haven appeal of the US dollar.
Given the elevated levels of US economic policy uncertainty, including trade policy uncertainty, and increased partisan political conflict associated with the Trump administration, US and global trade and investment can be expected to be weaker than if the administration followed a more predictable economic policy path at home and abroad. The historical correlation with Australian policy uncertainty suggests that Australia will suffer from increased uncertainty as a result, although the main economic effect will be a lower Australian dollar exchange rate and lower real interest rates.
A key policy implication is that reducing policy uncertainty can be expected to benefit cross-border trade and investment, as well as domestic economic activity. Reducing uncertainty requires only that policymakers adhere to well-defined, transparent and rules-based policy frameworks. This requires a more disciplined approach to policymaking, but can be done at relatively little fiscal cost.
Domestically, this means adhering to fiscal and monetary policy rules. Entering into bilateral, plurilateral and multilateral trade agreements that define the rules of international trade and investment can help reduce uncertainty. Support for the rules-based international trading system under the auspices of the World Trade Organization can also be expected to reduce both economic and economic policy uncertainty.
Elections and changes in prime minister inevitably give rise to increased economic policy uncertainty. However, this can be minimised through bipartisan commitments to policies and policy frameworks that maintain the continuity of policy when there is a change of government, at least where those policies are serving the country well.
While Australian policymakers cannot do much about uncertainty generated by policy decisions abroad, foreign uncertainty is still filtered through the lens of Australian political and economic institutions. Australian policymakers can reduce the impact of foreign uncertainty shocks by responding to these events in clear and predictable ways. By supporting a rules-based political and economic order both at home and abroad, Australian policymakers can mitigate — even if they cannot entirely eliminate — the negative economic implications of foreign and domestic policy uncertainty shocks.
Another policy implication is that economic policy instruments such as monetary policy can be expected to have more modest effects in the presence of economic and economic policy uncertainty. This does not mean that monetary policy is ineffective, but implies that monetary policy will need to be used more aggressively to maintain the predictability of inflation outcomes consistent with the inflation targeting framework. The recent undershooting of inflation targets in Australia and the United States implies that monetary policy has not been used as aggressively as it could have been.
Data appendix
Definitions for the variables used in the estimated model are shown below. All variables are in log-levels and Hodrick-Prescott filtered.
|
Variable name |
Definition |
Series identifiers and source |
|
gepu |
Purchasing power parity-adjusted, GDP-weighted average of national EPU indices for Australia, Brazil, Canada, Chile, China, France, Germany, India, Ireland, Italy, Japan, Mexico, the Netherlands, Russia, South Korea, Spain, Sweden, the United Kingdom, and the United States |
|
|
gip |
Global industrial production |
CPB World Trade Monitor, www.cpb.nl/en/worldtrademonitor |
|
gtv |
Global trade volumes |
CPB World Trade Monitor, www.cpb.nl/en/worldtrademonitor |
|
commod |
RBA Index of Commodity Prices in USD terms, deflated by US Producer Price Index |
GRCPAIUSD, www.rba.gov.au |
|
audreer |
Australian dollar trade weighted exchange rate adjusted for consumer prices |
FRERTWI, www.rba.gov.au |
|
audr |
Australian government three-year bond yield less annual rate of consumer price inflation excluding interest and tax changes |
FCMYGBAG3, GCPIEITCYP, www.rba.gov.au |
|
gne |
Australian gross national expenditure, chain volume measure, seasonally-adjusted |
A2304113C, www.abs.gov.au |
|
atv |
Australian trade volumes, sum of real imports and exports on a balance of payments basis |
A3535542V, A3535543W, www.abs.gov.au |
|
aufdi |
Foreign direct investment in Australia, real transactions only, added to the stock of FDI in Q3 1988 |
A3535467F, A3535463W, www.abs.gov.au |
|
auport |
Foreign portfolio investment in Australia, real transactions only, added to the stock of portfolio investment in Q3 1988 |
A3535491F, A3535487R, www.abs.gov.au |
|
aufdia |
Australian direct investment abroad, real transactions only, added to the stock of FDI abroad in Q3 1988 |
A3535365T, A3535361J, www.abs.gov.au |
|
auporta |
Australian portfolio investment abroad, real transactions only, added to the stock of portfolio investment abroad in Q3 1988 |
A3535401R, A3535397K, www.abs.gov.au |
|
auporta |
Australian portfolio investment abroad, real transactions only, added to the stock of portfolio investment abroad in Q3 1988 |
A3535401R, A3535397K, www.abs.gov.au |
|
epu |
US Economic Policy Uncertainty Index |
|
|
ustv |
US trade volumes, sum of real exports of goods and services, billions of chained 2009 dollars, quarterly, seasonally adjusted annual rate |
EXPGSC1, IMPGSC1, fred.stlouisfed.org |
|
usfdi |
Foreign direct investment in the United States, stock, at market value, quarterly, not seasonally adjusted |
IIPDIRELMVQ, fred.stlouisfed.org |
|
usport |
Foreign portfolio investment in the United States, stock, at market value, quarterly, not seasonally adjusted |
IIPPORTLQ, fred.stlouisfed.org |
|
usdreer |
Real Trade Weighted US Dollar Index: Broad, Index March 1973 = 100, quarterly, not seasonally adjusted |
TWEXBPA, fred.stlouisfed.org |
|
usr |
Three-year Treasury constant maturity rate, per cent, quarterly, not seasonally adjusted minus Consumer Price Index for All Urban Consumers: All Items Less Food and Energy, per cent change from year ago, quarterly, seasonally adjusted |
GS3, CPILFESL_PC1, fred.stlouisfed.org |
|
gdp |
US real GDP, billions of chained 2009 dollars, seasonally adjusted annual rate |
GDPC1, fred.stlouisfed.org |
|
usdia |
US direct investment abroad, stock, at market value, quarterly, not seasonally adjusted |
IIPDIREAMVQ, fred.stlouisfed.org |
|
usporta |
US portfolio investment abroad, stock, at market value, quarterly, not seasonally adjusted |
IPPORTAQ, fred.stlouisfed.org |
|
pc1 |
Partisan conflict index, average of 1990 = 100 |
IPPORTAQ, www.philadelphiafed.org/research-and-data/real-time-center/partisan-conflict-index |


