Foreword
The United States Studies Centre (USSC) is proud to publish new research on a critical issue for Australia: the increasing cost of energy.
This study — supported by Dow Chemical and Chemistry Australia — helps Australians understand our energy crisis from a comparative perspective, presenting the recent US energy experience as a stark contrast with the Australian story. The US-Australia comparison vividly highlights that Australia’s energy woes go beyond household electricity bills. Australian businesses confront energy costs that threaten jobs and investment and reverberate through the entire economy, raising the prices of goods and services for households.
Why is the United States Studies Centre engaging with this topic? In 2017, we published a landmark study documenting the depth and value of the US-Australia investment relationship — far and away Australia’s largest investment relationship — with more than A$1.5 trillion in the two-way relationship. In discussing the prospects of investments both from and in the United States, Australian manufacturers repeatedly rated the United States as vastly more attractive for investment. They indicated that Australia was not a growth market for their businesses and that the United States figured prominently in their plans for growth and success. “Australian manufacturing is doing great”, one CEO said, “just not in Australia”.
The cost of electricity and gas for large, industrial consumers of energy is simply making Australia uncompetitive. Relatively high labour costs are more or less baked into the Australian social compact. But when another critical business input — energy — becomes as expensive as it has, many Australian businesses face existential threats.
And why? In a word: energy. The cost of electricity and gas for large, industrial consumers of energy is simply making Australia uncompetitive. Relatively high labour costs are more or less baked into the Australian social compact. But when another critical business input — energy — becomes as expensive as it has, many Australian businesses face existential threats.
This research is the first work of what will be a multi-year project on energy and the environment at the United States Studies Centre. The Centre’s motto is “Analysis of America, Insight for Australia”. This report delivers both. The data we present underscores just how expensive Australian energy is relative to the United States. Economic modelling reveals the bleak consequences for the Australian economy as businesses and households confront increasing energy costs. Our first piece of research is designed as a salience-raising exercise, the vivid contrast with the United States injecting urgency — if not a sense of emergency — into the Australian conversation around energy.
Detailed policy recommendations will follow in subsequent reports. For now, we highlight key US and Australian energy policies that should be evaluated and flag important policy pathways forward for Australia. We do note that in Australia, achieving emissions reduction and lowering energy prices are often seen in a zero-sum lens. Indeed, the past decade of debate in Canberra reflects this. But as the US energy revolution reveals, emissions reductions and affordable energy need not be mutually exclusive outcomes. This particular insight ought to shape policymakers and organisations mapping an economically and environmentally sustainable future for Australia’s energy needs.
I thank Dr Alex Robson, the principal researcher on this project, for his leadership and labours on this report. I also thank Chemistry Australia for their support and for supplying data on just how critical Australia’s energy crisis is in their industry.
I especially thank Dow Chemical Australia and Louis Vega, Dow’s president and managing director, for Australia and New Zealand, for helping the USSC fulfil its mission of educating Australians about our relationship with the United States.
Professor Simon Jackman
Chief Executive Officer
United States Studies Centre at the University of Sydney
Executive summary
Australia and the United States have much in common: liberal, democratic institutions; technologically advanced, largely open economies; growing populations; demanding infrastructure; and above all, abundant energy resources.
But with respect to energy, Australia and the United States are on radically different paths. Australia faces an energy crisis, stressing households and businesses, but threatening the very existence of some of Australia’s large industrial users of energy. The United States is reaping the benefits of energy boom, delivering inexpensive gas and electricity, driving a renaissance in American manufacturing and economic growth. Specifically:
- Australian households and businesses pay dramatically more for their energy than their American counterparts — two to three times as much in many cases.
- American households and businesses are supplied energy with greater reliability and tariff transparency than in Australia.1
- Over the past decade, US carbon emissions from electricity generation have declined by more than twice the rate of Australia’s emissions decline.2
Why is US energy so inexpensive? Why is its electricity more reliable and pricing more transparent than Australia’s? Why are its carbon emissions declining faster relative to Australia? In this report we answer those questions, clarifying what’s at stake if Australian policymakers do not change course.
Economic modelling in this report indicates what’s at stake. Because energy is a non-substitutable good, consumed by households and businesses alike, high energy costs reverberate through the entire economy. A 25 per cent increase in electricity generation prices and domestic gas prices costs more than 33,000 Australian jobs and 1.15 per cent of GDP. The modelling may underestimate the actual impact of significant price increases.
Recent media and political commentary focuses on energy costs for Australian households. But for a globalised economy like Australia’s — with relatively high labour costs — high energy costs pose an immediate and dire threat to businesses that consume large quantities of energy, with manufacturing, chemicals, and steel among the sectors at most risk. Investments in these sectors is unattractive absent certainty about the costs of energy. Case study evidence indicates that some firms will cease operations altogether if they cannot secure economically viable gas prices for 2019 and beyond.
A key lesson of the US energy revolution for Australia is that resource abundance will only get the economy so far. Increasing energy supply is not enough. Institutional arrangements and property rights, free markets, infrastructure development and regulatory and policy settings all play an important role. The architecture of Australian’s energy markets also require reform, if not transformation. Get the institutional and policy settings right, and the market will transform physical abundance into economic abundance and put downward pressure on energy prices and emissions.
Energy and gas prices in Australia and the United States
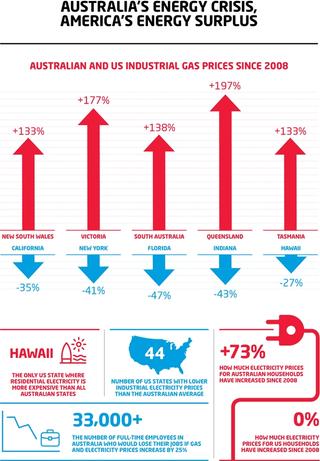
Based on 2017-18 data, there is only one US state with higher average household electricity prices than every Australian state and territory: Hawaii. Australian businesses fare no better. Forty-four US states have lower average industrial electricity prices than the Australian average.
Yet electricity prices are only part of the story. Queensland households pay more for gas than any US state, while households in South Australia, Tasmania, New South Wales and Victoria pay more for gas than 48 US states.
An essential and irreplaceable input to many types of manufacturing, natural gas is now more than twice as expensive for Australian manufacturers as it is for their counterparts in the US state of Louisiana. And compared to 10 years ago, in nominal terms natural gas is now 177 per cent more expensive for a Melbourne-based manufacturer and 41 per cent cheaper for a New York-based manufacturer.3
Impact on Australia’s economy
Economic modelling indicates that a permanent 10 per cent increase in both domestic gas and wholesale generation prices would likely lead to a permanent reduction in GDP by 0.46 per cent, equal to an annual economic loss of A$8.5 billion — which is greater than the total value of Australia’s beef exports in 2016-2017.4
A 25 per cent increase in both domestic gas and wholesale generation prices would lead to a 27 per cent decline in the output of Australia’s chemical, rubber and plastic industries. These price hikes would also likely cause an annual economic loss of some A$19 billion, an amount equal to how much Australia gained from foreign students in 2015, Australia’s third largest export.5
What went wrong in Australia, what went right in the United States
US energy and gas prices weren’t always cheap. Indeed, Australia and the United States have in many ways reversed their energy situations over the past decade.
A key factor in the United States has been the responsiveness of markets and policy to increases in energy costs. The price signal triggered greater exploration, resource development and increases in supply. When prices rise, more supply is forthcoming. That is how well-functioning markets — supported by policy — are supposed to work. In contrast, in Australia the investment and supply response to recent higher domestic energy prices is muted.
What Australia should do
In the long term, if Australia wants to reduce energy prices and carbon emissions while maintaining reliability, it should increase the supply of cheap domestic gas. The US experience makes this obvious. The US shale revolution — combined with the policy settings and infrastructure facilitating it — has allowed US gas and energy prices to remain flat or decrease over time for homes and businesses. With its dramatically smaller carbon footprint relative to other fossil fuels, natural gas is a ‘bridge fuel’ between the status quo and a renewable future. An increase in the share of gas in US energy consumption — increasing to 36 per cent of fossil fuel consumption from 27 per cent in the past decade6 — has seen the United States already achieve Paris Agreement emission reduction targets in its electricity sector.
The essential role of gas in manufacturing
Manufacturers need large amounts of energy to make their products, but certain manufacturers need natural gas in particular. In the same way that grass is required for dairy milk or iron ore is required for steel, chemical manufacturers use compounds such as ethane and methane — present in natural gas in varying amounts — as inputs for a vast range of products, ranging from fertilisers and explosives to pipes and milk packaging.
In 2016-17, manufacturers accounted for 40 per cent of Australia’s gas consumption,7 either as a feedstock (vital raw input) for heating or steam processes or for on-site electricity generation. Two-thirds of all manufacturing gas in 2016-2017 was consumed by just two sectors: chemicals and non-ferrous metals. As a consequence, a significant part of Australia’s A$102 billion manufacturing sector is heavily exposed to increases in gas prices.
Approximately one in every four Australian manufacturing workers work in heavily gas-reliant sectors. In turn, another 56 per cent work in related industries which do business with these manufacturers.8
The exposure or incidence of price increases tends to be most acute in the case of feedstock use.
Due to underlying technology of the production processes:
- Manufacturers cannot easily substitute other fuel sources;
- Production cannot simply be incrementally ramped up and down over short time periods — facilities tend to work on a binary “on-off” basis.9
A tale of two countries: energy prices in Australia and the United States
On average, Australian households sourcing electricity from Australia’s National Electricity Market (NEM) pay higher retail prices than all but a handful of US jurisdictions. The price differentials are not small, ranging from double to almost triple the costs when compared to some US states.
The same comparison can be made for household gas prices, with similar results. The data in Figure 2 indicates that on average, household gas consumers on Australia’s east coast pay between two or three times the prices that the average US household pays.
Figure 1: Residential gas prices, Australia v US, 2017
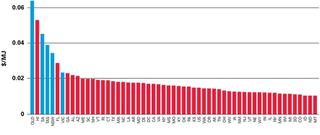
Figure 2: Residential electricity prices (PPP adjusted), Australia v US, 2017-18
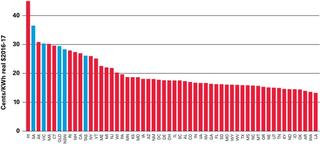
The situation is no better for Australia’s businesses. As Figure 3 and Figure 4 demonstrate, if Australia was a US state, it would be one of the most uncompetitive jurisdictions in terms of energy prices.
Figure 3: Industrial gas prices, Australia v US, 2017
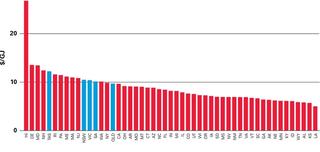
Figure 4: Industrial electricity prices (PPP adjusted), Australia v US, 2017-18
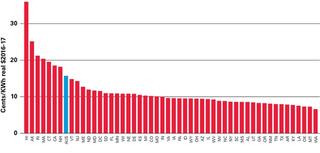
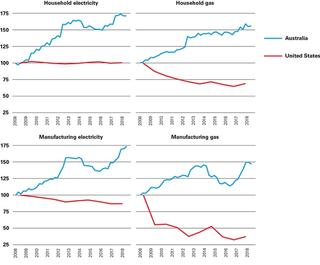
Figure 5 shows that since 2008, average electricity prices in Australia have increased by around 70 per cent in real terms for both households and businesses.
In contrast, average US household electricity prices have remained fairly steady in real terms over the past decade. Average electricity prices have fallen by more than 10 per cent in real terms for US industrial users. Finally, over the past decade, the average real price of gas in the United States has declined by about 30 per cent for households, and by more than 50 per cent in real terms for industrial users.
To put that into perspective: in real terms, Australian-based manufacturers are now paying 47 per cent more for gas than they did 10 years ago, while an American competitor is paying 63 per cent less.10
In summary: on electricity and gas price outcomes, the two economies have taken completely opposite paths.
Figure 5: Real electricity and gas prices since 2008
What’s at stake? The economic impact of higher energy prices
Why does it matter that Australia’s energy costs have risen by so much and that it is now so uncompetitive with the world’s largest economy? The reason is straightforward: energy is a key intermediate input into the production of almost all goods and services in Australia and the United States, and is used intensively by heavy industry and manufacturing.
It was noted previously in this report that natural gas is used as a feedstock in a range of manufacturing industries, including the production of chemicals, plastics, rubber, fertiliser, mining and metals processing, pulp paper and printing, and food and beverage manufacturing.11 And of course gas and electricity are also consumed in households and are key inputs into household products and services.
Unlike most goods or services or business inputs, it is difficult to mitigate or avoid the impact of energy price increases by substituting other inputs or products.
Increases in energy prices therefore increase overall costs for virtually the entire economy. And critically, energy has the important economic characteristic of non-substitutability: unlike most goods or services or business inputs, it is difficult to mitigate or avoid the impact of energy price increases by substituting other inputs or products. This is rarely possible for electricity and gas, at least in the short run.
Accordingly, energy price increases have indirect or secondary impacts: they push up the prices of other inputs and consumption goods. For example, an increase in electricity prices directly hits household budgets as the power bills come in; but the consumer prices of other goods that use electricity as an input also rise. Both effects reduce real wages, household incomes and overall living standards.
For businesses, these primary and secondary cost increases are either passed down the business supply chain to other businesses or, in the case of final consumption goods, passed on to households.
On the other hand, in some industry sectors, energy cost increases may not be passed on at all. Many Australian businesses are trade exposed — they cannot afford to raise their export prices in response to cost increases when their international competitors do not face similar changes in economic conditions. These energy-intensive, trade-exposed businesses must simply absorb these cost increases, with the economic consequences borne by workers and shareholders.
Case studies
To better understand the economic consequences of high energy prices, we looked closely at a number of individual Australian firms, documenting the way they rely on energy as an input to their business, the threats posed by high energy costs, and how they are all forced to look at cost reductions as a result.
Bluescope Steel
Bluescope is a major Australian steel product manufacturer. Steel product manufacturers are major users of electricity and gas. The company operates manufacturing plants in New South Wales, Victoria, and Queensland, and employs around 6,500 people in Australia. The building and construction sector accounts for around 70 per cent of the company’s domestic sales. In 2017, Bluescope CEO Paul O’Malley stated that energy costs in the United States were up to 10 times lower than what Bluescope pays in Australia.12 In its 2016-17 results, Bluescope announced that its electricity and gas costs had increased by 25 per cent on the previous corresponding period. The company also forecast that its electricity costs would increase by a further 53 per cent in 2017-18, for a total increase across the two years of A$54 million (overall, a near doubling of costs across just two years).13

Qenos
Qenos is Australia’s only producer and leading supplier of polyethylene and ethylene, with manufacturing operations in Victoria and New South Wales. Polyethylene manufacturing is a highly energy-intensive process. The product is an essential input into downstream Australian polymer processors for the manufacturing of products such as milk bottles, water tanks, pipes and packaging. The company directly employs 650 people and another 350 contractors, and has annual revenues of around A$700-900 million.
The company is heavily trade exposed. Cost increases cannot be passed on to customers, who can turn to offshore suppliers. Through the east coast gas crisis, Qenos’ feedstock and energy costs have risen by more than A$70 million per year — an increase of 50 per cent. In addition, the company is facing shortfalls in its supply of ethane feedstock. In 2017, the company announced it had no choice but to lay off 15 per cent of its employees.14
Incitec Pivot
Fertiliser plants use methane (the predominant component of natural gas) in the production of ammonia. Incitec Pivot’s (IPL) Gibson Island fertiliser plant in Queensland employs 450 people. Its current 10-year gas agreement was put in place before Australia’s recent LNG boom. The Brisbane facility uses around 14 PJ of gas per year, an estimated 12 per cent of Queensland’s entire industrial gas demand. According to EnergyQuest,15 under the existing agreement the gas would have been priced at around A$3.00/GJ, plus a pipeline tariff of around A$0.90/GJ. But under IPL’s new interim agreement to the end of 2019, they will pay a new gas cost of around A$8.55/GJ, increasing their annual costs by around A$50 million, reportedly wiping out profits at the plant for 12 months.16
In taking advantage of the reversing trends in energy situations between Australia and the United States, IPL famously decided to make a A$1 billion investment in the United States as opposed to in Australia in 2013. As of November 2018, IPL has said amidst decreasing profits that it will close its Gibson Island plant at a cost of some A$70 million if it cannot find affordable gas contracts.17
Modelling the consequences of higher energy costs
In order to provide further context to what’s at stake in the energy debate, a sophisticated economic model was employed, allowing us to trace out the anticipated economic effects of large, sustained increases in energy costs in the Australian economy.18
Two different price scenarios were studied: (1) a 10 per cent increase to domestic gas prices, wholesale costs of electricity, and the combination of both; (2) a 25 per cent increase to domestic gas prices, wholesale costs of electricity, and the combination of both.
In the ordinary course of events, one possible effect of such price increases to gas would be that gas exporters substitute some export gas into the domestic market. However, part of the problem with the recent operation of Australia’s east coast gas market is that this additional supply has not been forthcoming. To isolate price effects and to capture the fact that substitution on the supply side by gas producers has been constrained, this possibility is deliberately ‘switched off’ in the modelling scenarios.
The increase in electricity prices is intended to capture one of the possible effects of ill-advised or inappropriate state or federal government interventions — for example, the introduction of policies that stimulate the introduction of low quality, inefficient generation assets into the production mix.
It is important to note that these modelling scenarios are illustrative only. The purpose of the modelling is to demonstrate — in a setup which attempts to account for economy-wide adjustments in an internally consistent, methodologically rigorous way — the magnitude of what is at stake in Australia’s energy debate. The results are not forecasts or projections but scenarios. The economy-wide results of the CGE modelling are reported below.
The sign and magnitude of the modelling results are consistent with the earlier partial-equilibrium estimates based on energy accounts and expenditure shares.
- A permanent 10 per cent increase in wholesale generation costs to a permanent 0.3 per cent reduction in GDP, or an annual economic loss of around A$5.6 billion.
- A permanent 10 per cent increase in the domestic price of gas causes a permanent reduction in GDP of 0.19 per cent, which is an annual economic loss of around A$3.5 billion.
- The combined effect of a 10 per cent increase in both gas and electricity is a permanent reduction in GDP of 0.46 per cent — an annual economic loss of A$8.5 billion.
- A permanent 25 per cent increase in wholesale generation costs leads to a permanent 0.76 per cent reduction in GDP, or an annual economic loss of around A$13.9 billion.
- A permanent 25 per cent increase in the domestic price of gas causes a permanent reduction in GDP of 0.47 per cent, which is an annual economic loss of around A$8.7 billion.
- The combination of both scenarios in a 25 per cent increase is a permanent reduction in GDP of 1.15 per cent — an annual economic loss of A$21.2 billion.
Consistent with the overall negative impacts, in all scenarios, real wages, jobs and investment fall. These estimates would obviously be larger for the significant increases in gas prices we have seen recently.
It is also possible to examine CGE model predictions of sectoral economic impacts under these scenarios. These industry-wide results are shown later in this report. As discussed previously, the effect across industries is not uniform, but energy-intensive, trade-exposed industries such as chemicals, plastics, and rubber manufacturing tend to be hit hardest. As the exchange rate, wages, prices and other variables change in response to the shock across the economy, some sectors win, whilst others lose — particularly those that are energy intensive or trade exposed. But the overall economic effect is clear: energy price increases impose significant costs on the Australian economy.
Table 1: Two economic scenarios
|
|
10% shock |
25% shock |
||||
|
|
Gas simulation |
Electricity simulation |
Combined simulation |
Gas simulation |
Electricity simulation |
Combined simulation |
|
GDP (% change) |
-0.19 |
-0.30 |
-0.46 |
-0.47 |
-0.76 |
-1.15 |
|
GNI (% change) |
-0.13 |
-0.30 |
-0.40 |
-0.33 |
-0.75 |
-1.00 |
|
Employment (FTE) |
-8,428 |
-5,375 |
-13,237 |
-21,079 |
-13,384 |
-33,049 |
|
Employment (% change) |
-0.08 |
-0.05 |
-0.12 |
-0.20 |
-0.13 |
-0.31 |
|
Real wages (% change) |
-0.52 |
-0.33 |
-0.82 |
-1.30 |
-0.83 |
-2.04 |
|
Investment (% change) |
-0.90 |
-0.42 |
-1.27 |
-2.25 |
-1.04 |
-3.18 |
|
Industry output |
% change |
% change |
% change |
% change |
% change |
% change |
|
Agriculture |
0.28 |
0.15 |
0.42 |
0.70 |
0.38 |
1.04 |
|
Coal |
0.81 |
-0.22 |
0.61 |
2.02 |
-0.56 |
1.52 |
|
Oil |
0.36 |
0.26 |
0.59 |
0.89 |
0.65 |
1.47 |
|
Gas |
-3.86 |
-0.21 |
-4.07 |
-9.67 |
-0.51 |
-10.18 |
|
Other minerals |
0.50 |
-1.44 |
-0.82 |
1.24 |
-3.59 |
-2.03 |
|
Bovine meat products |
0.86 |
0.26 |
1.09 |
2.15 |
0.64 |
2.72 |
|
Other meat products |
0.10 |
-0.05 |
0.06 |
0.24 |
-0.12 |
0.14 |
|
Vegetable oils and fats |
-0.54 |
0.00 |
-0.54 |
-1.35 |
0.00 |
-1.35 |
|
Dairy products |
0.16 |
-0.11 |
0.06 |
0.39 |
-0.27 |
0.15 |
|
Processed rice |
0.27 |
0.03 |
0.30 |
0.69 |
0.08 |
0.76 |
|
Sugar |
0.41 |
0.27 |
0.65 |
1.04 |
0.66 |
1.64 |
|
Food products nec |
0.14 |
-0.09 |
0.05 |
0.35 |
-0.23 |
0.13 |
|
Beverages and tobacco products |
0.07 |
-0.07 |
0.01 |
0.18 |
-0.17 |
0.03 |
|
Textiles |
0.61 |
0.23 |
0.81 |
1.52 |
0.57 |
2.02 |
|
Wearing apparel |
0.63 |
0.15 |
0.76 |
1.56 |
0.38 |
1.90 |
|
Leather products |
-0.69 |
0.64 |
-0.11 |
-1.72 |
1.59 |
-0.27 |
|
Wood products |
0.30 |
0.20 |
0.48 |
0.75 |
0.49 |
1.19 |
|
Paper products, publishing |
-0.15 |
-0.16 |
-0.29 |
-0.37 |
-0.40 |
-0.73 |
|
Petroleum, coal products |
-0.66 |
-0.10 |
-0.76 |
-1.65 |
-0.26 |
-1.89 |
|
Chemical, rubber, plastic products |
-11.08 |
0.08 |
-10.96 |
-28.03 |
0.19 |
-27.72 |
|
Mineral products nec |
-0.53 |
-0.40 |
-0.89 |
-1.33 |
-1.00 |
-2.24 |
|
Ferrous metals |
0.46 |
-0.45 |
0.05 |
1.15 |
-1.13 |
0.11 |
|
Metals nec |
0.77 |
-4.30 |
-3.13 |
1.93 |
-11.08 |
-8.14 |
|
Metal products |
-0.04 |
-0.15 |
-0.17 |
-0.09 |
-0.36 |
-0.42 |
|
Motor vehicles and parts |
0.51 |
0.23 |
0.72 |
1.27 |
0.58 |
1.79 |
|
Transport equipment nec |
0.73 |
0.29 |
0.99 |
1.82 |
0.73 |
2.49 |
|
Electronic equipment |
1.03 |
0.28 |
1.28 |
2.58 |
0.70 |
3.21 |
|
Machinery and equipment nec |
0.81 |
0.20 |
0.98 |
2.01 |
0.49 |
2.45 |
|
Manufactures nec |
0.10 |
0.03 |
0.13 |
0.25 |
0.07 |
0.32 |
|
Electricity |
-0.12 |
-4.39 |
-4.07 |
-0.30 |
-11.26 |
-10.43 |
|
Water |
-0.11 |
-0.25 |
-0.34 |
-0.28 |
-0.64 |
-0.85 |
|
Construction |
-0.74 |
-0.43 |
-1.13 |
-1.85 |
-1.08 |
-2.82 |
|
Trade |
-0.12 |
-0.22 |
-0.31 |
-0.29 |
-0.55 |
-0.79 |
|
Transport |
-0.02 |
-0.12 |
-0.13 |
-0.05 |
-0.30 |
-0.31 |
|
Communications |
-0.05 |
-0.19 |
-0.22 |
-0.12 |
-0.48 |
-0.54 |
|
Financial services |
0.09 |
-0.15 |
-0.04 |
0.23 |
-0.37 |
-0.09 |
|
Business services |
-0.21 |
-0.19 |
-0.39 |
-0.53 |
-0.48 |
-0.96 |
|
Recreation and other services |
0.04 |
-0.17 |
-0.10 |
0.11 |
-0.41 |
-0.26 |
|
Government services |
0.12 |
-0.13 |
0.00 |
0.29 |
-0.32 |
0.01 |
Major Australian policy developments over the past decade
Why has Australia’s recent experience with energy prices been so different from that of the United States? Australia has not always been so uncompetitive. Between 1999 and 2006, for example, US gas prices increased rapidly, more than doubling over the period. The key factor in the United States was the responsiveness of markets and policy to these price increases. They were an important trigger for important changes that have followed, providing the incentive for greater exploration, resource development and increases in supply. When prices rise, more supply is forthcoming. That is how well-functioning market signals — supported by policy — are supposed to work.
In contrast, in Australia the investment and supply response to recent higher domestic energy prices appears to be muted. Gas exploration and development (even for conventional gas) has been banned in some states,19 and rapid technological improvements and innovations in coal-fired power technology — which will be an important source of baseload power for many years to come20 — appear to have no bearing on the likelihood of the new generation being built.
There is little doubt that this situation is at least partly due to Australia’s policy environment, which continues to be characterised by instability and uncertainty. Even during the height of Australia’s carbon tax debate, things were never this bad. Indeed, the modelling supporting the Gillard government’s carbon tax contemplated more than A$100 billion of investment in coal and gas generation in Australia over the next few decades.

The United States is such a large economy that the influence of policy on the decision to close a single individual power plant has a relatively small impact upon overall affordability, reliability and system performance. But that is not the case in Australia. The effect on prices of the 2017 closure of the Hazelwood power station in Victoria is a direct case in point — the closure of this single 1600MW power station (generating around 5 per cent of total NEM output) led to higher wholesale prices in a number of states.21 Almost all reputable modelling projections forecast that similar effects will follow from the future closure of individual coal-fired generators.
The ‘lumpiness’ of Australia’s existing generation mix and the characteristics of its east coast grid (its geographic extent and ‘skinniness’) means that policy choices are likely to be a more important and direct determinant of affordability and reliability than in the United States. There is simply much more at stake in individual policy decisions in Australia — the costs of mistakes (and the benefits of good policy) are that much higher.22
The major policy developments in Australia recently can be summarised as follows:
Phase 1 — 2008-2013: Prices rose in line with the recovery of higher regulatory network investment costs, on the back of additional reliability requirements which were largely imposed by state governments and approved by regulators. The Rudd government introduced the mandatory renewable energy target (MRET — read on for further details). The carbon tax policy debate also kicked off in earnest during this period, with plans for a tax put in place by the Gillard government following the 2010 election. The carbon tax eventually came into effect in July 2012.23 Meanwhile, east coast LNG producers ramped up investment (which would eventually amount to more than A$200 billion), with eight new Australian gas liquefaction projects receiving final investment approval between 2007 and 2012.24 Following their development, Australia’s domestic gas market became linked with prices in the international gas market. Between March 2008 and September 2013, average real household electricity prices increased by 65 per cent — including the effect of the carbon tax, which saw the largest ever single-quarter jump in the electricity price component of the Consumer Price Index.
Phase 2 — 2013-2016: The Abbott government removed the carbon tax, with the change taking effect on 1 July 2014. The MRET was modified in May 2015, with a reduced target. Between September 2013 and March 2016, average real household electricity prices fell by 9 per cent in real terms.
Phase 3 — 2016-2018: Victoria’s Hazelwood power station shut down on 31 March 2017. The east coast gas crisis hits, with prices rising and the looming threat of supply shortages in the domestic market. In June 2017 the Turnbull government introduced the Australian Domestic Gas Security Mechanism (ADGSM). The policy required LNG projects drawing gas from Australia’s domestic market to limit their exports, or find offsetting sources of new gas. The National Energy Guarantee (NEG) policy debate also began: in October 2017, the Turnbull government outlined plans for both an emissions obligation and a reliability obligation to be imposed on electricity retailers. The emissions obligation was eventually dropped, but the reliability obligation remains. Between March 2016 and June 2018, average real household electricity prices increased by more than 14 per cent.
How can a country like Australia — with abundant fossil fuel resources and abundant sources of ‘free’ renewable electricity generation — find itself in a situation with high electricity and gas prices? And with so many unconventional gas reserves, how is it possible that we have had apparent shortages of domestic gas?
The Australian Competition and Consumer Commission (ACCC) has recently decomposed retail price levels and price changes into their component parts. Their analysis shows that there is no great mystery as to why Australia has high energy prices. The ACCC’s analysis shows that high prices are largely a direct consequence of poor policy choices over the past decade, which have driven costs upwards right across the supply chain: higher network (distribution and transmission) costs, higher wholesale generation costs, costly and ineffective environmental policies, and elevated retail margins.25
There are two apparent paradoxes at the heart of the most recent price increases in Australia: how can a country like Australia — with abundant fossil fuel resources and abundant sources of ‘free’ renewable electricity generation — find itself in a situation with high electricity and gas prices? Even more paradoxically, with so many unconventional gas reserves coming online recently, how is it possible that we have had apparent shortages of domestic gas?
Table 2 shows that both Australia and the United States have ample reserves of coal and gas. To put these reserves in perspective, consider natural gas. Total world reserves in 2017 were 7,209 EJ (exajoules), with global consumption equal to 136.7 EJ. Australia’s LNG exports in 2017 were 2.7 EJ, just 2 per cent of its estimated total reserves. And those exports dwarf consumption of gas in the domestic market. In a physical sense, Australia does not have a gas shortage.
Table 2: Estimated coal and gas reserves, United States v Australia, 2017
|
|
United States |
Australia |
|
Coal |
250,916 Mt |
144,818 Mt |
|
Natural gas |
325.5 EJ |
135.4 EJ |
|
Natural gas production |
27.4 EJ |
4.2 EJ |
|
Natural gas consumption |
27.6 EJ |
1.6 EJ |
|
Net exports |
-0.2 EJ |
2.7 EJ |
Australia also has abundant wind and solar natural resources, as well as some of the largest uranium deposits in the world. Nevertheless, whilst network costs and the carbon tax were the main drivers of the first phase (2008-2016) of electricity price increases discussed previously, it is widely acknowledged that more recent retail price rises have largely been driven by increases in wholesale electricity costs, partly as a consequence of increases in fuel costs for both coal and gas. Australia’s renewable energy policies, the withdrawal of coal-fired generation plants, and other market design features of the NEM also played important roles.26
The hidden roles of gas and electricity
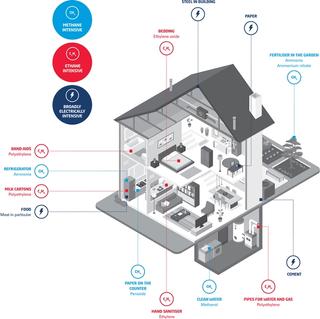
Energy is such an integral part of our lives that its use can go practically unnoticed.
We often think of our paying for energy in the form of household bills for lights, gas cooktops and heating, but energy costs are factored into nearly every item we use.
From the food we eat to the mattresses we sleep on, energy — and gas in particular — is a critical component of our lives.
These are issues that lie at the heart of Australia’s economic future. Beyond energy bills or even jobs at manufacturing plants, an increased cost of energy impacts practically every aspect of our lives.
Some manufacturers, namely in the chemicals industry, are reliant on converting the raw gas molecule into a wide range of intermediate and finished products. The lack of an affordable supply of raw gas, specifically the methane and ethane components of it, is an existential threat to chemicals manufacturers.
What has gone wrong in Australia?
To understand what has gone wrong, it is useful to start with some basics of the demand for electricity. Demand varies throughout the day, and also varies throughout the year according to seasonal factors and temperature. Intraday demand typically has two peaks: one in the morning at around 8am and another in the evening at around 6.30pm or 7pm. There are also seasonal summer and winter peaks (with the former exceeding the latter).
System operators match supply with demand. They must ensure that there is adequate baseload generation which covers the minimum amount of intraday demand, but must also ensure that there is enough supply to meet intraday peaks and peaks across seasons. These two constraints impose constraints on the underlying generation technology as well as the operation of the grid. Even if supply fluctuates, if it is predictable and perfectly matches fluctuations in demand, then that will impose fewer requirements on the system, compared to a situation in which intermittent supply is unpredictable and does not match demand.
Although it seems strange that the introduction of more low-cost or ‘free’ renewable energy sources could be associated with higher wholesale prices, there is actually no paradox. Over the past decade, implicit and explicit subsidies, together with improvements in technology, have rapidly brought additional renewable generation into the Australian market, but without sufficient storage capacity.
The main issues with wind and solar generation are their variability, lack of predictability and the fact that fluctuations in supply tend to bear little or no relationship to either baseload demand or the timing or size of peak demand.27 This makes large-scale storage options — for example, large batteries and pumped hydro facilities — a vital part of any future renewables mix. Developing a mechanism to price reliability and force renewable producers to internalise the negative externalities they impose on the system was therefore one of the key objectives of the National Energy Guarantee (NEG). The NEG also sought to end subsidies for renewable technologies, including the implicit subsidies created by arbitrary targets. After all, technologies with low marginal costs and falling capital costs — and which impose system costs on the grid — do not need subsidies.
This phenomenon also increased the potential gains to individual producers who are strategically withholding supply — there is a greater payoff from engaging in anti-competitive behaviour.
In the NEM, prices are set by the marginal producer, in what is effectively a reverse uniform-price auction where all bidders receive the market clearing price. Since wind and solar have low short-run marginal costs (weather permitting), they are inframarginal and do not tend to set the wholesale market price. All else being equal, the introduction of low-cost technologies would ordinarily shift the merit order curve or supply curve to the right, leading to lower prices. Indeed, notwithstanding the intermittency of renewables and the system costs they impose on the grid, many economic forecasting models of the electricity market project that with relatively flat demand, a greater supply of subsidised renewables (whose capital costs are projected to fall further), will tend to put downward pressure on wholesale prices.
In practice, of course all else has not been equal: there have been offsetting effects elsewhere along the supply curve. Coal generators have been retired — sometimes due to economic factors, but also as a result of deliberate policy decisions or non-economic factors. This has meant that gas peakers — plants that usually only run when there is a high demand — and other relatively high-cost producers have increased the frequency with which they have acted as the marginal supplier or price setter. The supply or merit order curve has effectively been squeezed in the middle and has become steeper, which also leads to greater price volatility in response to demand shifts. This phenomenon also increased the potential gains to individual producers that are strategically withholding supply — there is a greater payoff from engaging in anti-competitive behaviour. The problem gets worse as more renewables are injected into the system at the same time that baseload power generators are removed — and get much worse if gas is only available at higher prices.
It is also important to note that Australia’s east coast gas crisis has not just been about price rises. Manufacturers and industrial users also reported apparent shortages of gas — no gas was forthcoming at any price. In other words, following the LNG boom, a gap opened up between gas production on the one hand, and domestic consumption plus contracted export supply on the other. But how does such a gap actually open up in the first place? The answer is straightforward: if exporters contract for a certain amount of gas exports and their costs rise unexpectedly or fields do not produce as much as had been expected, then it may simply become infeasible for the market to simultaneously supply domestic users with sufficient gas and meet export targets. The resulting gap can only be closed by cutting back exports, or rationing domestic consumers out of the market, via a combination of higher domestic prices and/or lower domestic supply. Domestic consumers (e.g. business and households) will be forced to buy less gas, at a higher price — which is exactly what has occurred. And under these conditions, it can easily happen that the domestic price exceeds the world price (or netback price).
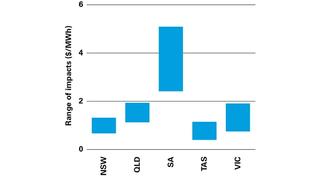
Figure 6: Estimated effects of a higher gas price on wholesale electricity prices
Range of increase in wholesale electricity prices due to a A$1/GJ increase in gas prices
The recent US experience: what went right?
The main lesson from Australia’s recent experience is that although we have abundant sources of energy in a physical sense, this absence of physical scarcity is not sufficient to ensure low electricity and gas prices for consumers and businesses. It is economic scarcity — not the amount of physical resources — that matters most for prices.
Simply put, an abundance of energy resources does not automatically guarantee cheap fuel — the resources must be extracted, refined, transported and marketed. Final energy prices also depend on a range of other factors, including the costs and productivity of generation plants (which depend on the productivity of labour and capital and the availability of land), the costs of building and maintaining transmission and distribution networks, and energy retailing and marketing costs. Final prices to households and businesses are also affected by policy settings, market structure and taxes.
So how has the United States managed to keep its energy prices affordable? In both Australia and the United States, the fuel for electricity generation is primarily sourced from coal and gas. Using installed capacity as a metric, 36.6 per cent of capacity in Australia’s NEM is from black coal, 9.4 per cent is from brown coal and 19.4 per cent is from gas.28 However, due to the intermittency of wind and solar, installed capacity figures are highly misleading — 78.8 per cent of actual electricity generation in Australia comes from coal and gas, with wind and solar generating only 9.8 per cent.
Figure 7: Electricity generation by fuel source, 2017
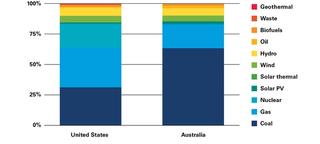
Policymakers in both Australia and the United States have been grappling with emissions reduction policies over the past decade. In both economies, there are a range of renewable energy policies that are similar in their policy intent: they are intended to encourage a greater supply of renewable energy into the grid. And the overall shares of renewable generation in both countries are roughly similar — so, it is difficult to point to differences in US renewables policy on their own being a key driver of cost differences between the two countries.
Table 3: Major renewable energy policies in Australia and the United States
|
Country |
Program |
Description |
Cost |
|
Australia |
Large-scale Renewable Energy Target (LRET) |
The LRET is an implicit tax-subsidy scheme favouring renewable generators. It requires retailers to purchase renewable energy certificates (LGCs) each year, irrespective of the economic value of energy that is generated. The LGC requirement is determined each year through the renewable power percentage (RPP), currently set at 16.06 per cent. The LRET is scheduled to increase to 33 TWh of generation by 2020 and remain at that level until 2030. The creation of LGCs will continue until 2030, but the overall amount of generation is legislated to remain constant over that period. LGCs are tax deductible. Liable entities which fail to surrender the required amount of certificates must pay a penalty charge of A$65 per certificate. LGCs are traded in a wholesale market. As at 7 November 2018, LGCs were trading at a price of A$64/MWh. |
A$1.4bn (2015-16)* |
|
Australia |
Small Scale Renewable (SRES) |
The SRES is effectively an up-front capital subsidy for individuals and small businesses who install eligible small-scale systems (e.g. small scale solar panels, wind, hydro). Liable entities are required to purchase certificates which are issued up front on the basis of expected generation over a 15-year period (or until 2030 after 2017). The ACCC has recently recommended that the SRES be abolished. |
A$726m (2015-16)* |
|
Australia |
State Feed-in-Tariffs (FiTs) |
FiTs are a direct subsidy to small scale renewable generators, paid for each kWh fed back into the grid. Whilst many mandated FiTs have been closed to new entrants, they continue for existing customers. See The Australian Energy Council (2018) for full details. |
N/A |
|
Australia |
State-based RETs |
VIC: 20 per cent by 2020 and 40 per cent by 2025. QLD: 50 per cent by 2030. SA: 50 per cent by 2025. Unlike the LRET, none of these targets are directly accompanied by an explicit target-linked mechanism to encourage new investment. |
N/A |
|
United States |
Production Tax Credit (PTC) |
The PTC is a FiT-like subsidy of US$24/MWh in real terms for certain renewables including wind during the first 10 years of generation. The subsidy to wind declined by 20 per cent in 2017, 40 per cent in 2018, 60 per cent in 2019, and is scheduled to end completely in 2020. |
US$25.6 bn between 2018 and 2022** |
|
United States |
Investment Tax Credit (ITC) |
The ITC is an SRES-like 30 per cent capital subsidy for new solar PV and thermal plants which begin construction before the end of 2019. The ITC is scheduled to fall to 22 per cent by 2021. In 2022 it will end for residential-owned systems, and will decline to 10 per cent for business and utility-scale systems. |
US$13.5 bn between 2018 and 2022** |
|
United States |
State Renewable Portfolio Standards (RPSs) |
RPSs are LRET-like implicit tax-subsidy schemes which require utilities to ensure that a percentage, or a specified amount, of the electricity they sell comes from renewable resources. Twenty-nine US jurisdictions have adopted an RPS, while eight states have set voluntary renewable energy standards/goals. (NCSL, 2018) |
N/A |
One obvious difference between Australia and the United States is the fuel mix of baseload electricity generation. The United States sources around 20 per cent of its electricity from nuclear generators. This provides an important source of reliable, low emissions baseload generation that Australia has chosen not to replicate. But the share of nuclear in the US generation fuel mix has remained relatively steady over the past decade, and is therefore unlikely to be a driver of recent movements in US-Australia energy price differentials over the period.
Second, although it is widely acknowledged that the withdrawal of coal generators has led to price increases in Australia (with further withdrawals predicted to lead to additional price increases in future years) the share of coal in the US generation mix has declined by around 40 per cent over the past decade. The withdrawal of coal has been so large that the United States now sources more generation from gas than it does from coal. The decline in coal’s share of the generation mix in the United States has dwarfed Australia’s coal withdrawals.
Finally — and most importantly — over the past two decades, both Australia and the United States have increased the share of gas as a fuel in the overall electricity generation mix. But the US gas share has been much higher over the period and has increased significantly over the past decade, whereas the growth in Australia’s gas share appears to have stalled recently.
Figure 8: Share of coal and natural gas in total electricity generation, Australia and the United States, 1985-2017
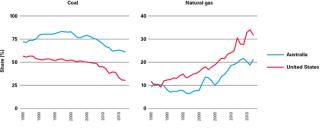
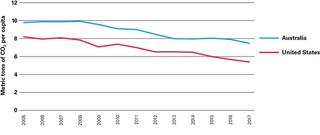
Since the burning of gas produces significantly lower emissions per unit of energy generated,29 the shift to gas has also meant that US emissions from electricity generation have declined by more than 28 per cent over the past decade, compared to an 11 per cent decline in Australia over the same period. Electricity carbon emissions per capita in the United States also declined faster in the United States (34 per cent) than Australia (24 per cent) in the past decade. Estimates from the Energy Information Administration (EIA) indicate that the change in the fossil fuel mix from coal to gas has led to cumulative emissions reductions which exceed those from the US switch to renewables generation by nearly 60 per cent.
Beyond carbon emissions, the economic impact of the shale gas revolution on the US economy has been significant. Bonakdarpour and Larson (2012) estimate the short run economic effects of US shale gas development (relative to a constrained shale gas development scenario) include a 1.1 per cent increase in GDP, a 3 per cent increase in industrial production, one million more US jobs and an increase in average household disposable incomes of US$926 per year.
Figure 9: Carbon emissions from electricity generation per capita, Australia and the United States
The US gas revolution: some key policy enablers
Simply put, over the past decade or so there has been a gas revolution in US energy markets. Since 2005, annual US gas production increased by more than 9,100 PJ — and effectively all of this additional production has been used for US domestic consumption.
Whilst the increase in US gas production is unlikely to be the only driver of US electricity and gas price outcomes, there can be little doubt it has had an important influence: greater supply drives down prices. Increased gas production has certainly put downward pressure on wholesale electricity costs. Figure 11 plots the average price paid for fuel per gigajoule at US electricity generating plants and shows that fuel costs for gas have more than halved over the period, in line with price reductions for households and other businesses.
In contrast, during the same period in Australia, annual gas production rose by 2,800 PJ, but domestic prices have risen and almost all of this additional production has been exported. And although the United States currently exports a roughly similar amount of natural gas as Australia in absolute terms (most via pipelines rather than as LNG), the sheer size of the US gas revolution means that these exports currently constitute only a very small fraction of overall US gas production.
Figure 10: Natural gas production, Australia and the United States, 1970-2017
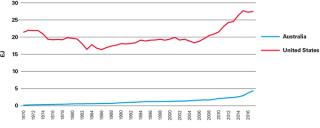
Figure 11: Cost of coal and gas receipts at US electric generating plants, 1973-2017
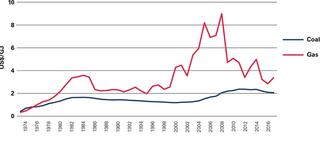
Figure 12: Natural gas net exports, Australia and the United States, 1970-2017
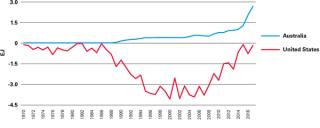
Figure 13: Natural gas: production, exports and imports, Australia and the United States, 2017
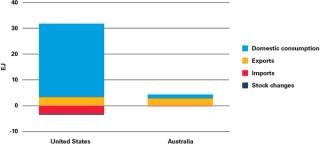
The US Natural Gas Act prohibits the export of natural gas without prior approval from the Department of Energy (DOE). The legislation requires the DOE to grant an export permit unless it finds that such action is not consistent with the public interest. However, in practice, the public interest test only applies to export destinations with which the United States does not have a free trade agreement — under the NGA, exports to an FTA country are automatically deemed to be in the public interest.30
The US gas revolution has meant that over the next few years the United States is expected to lift its LNG exports significantly. Indeed, more than half of the world’s additional supply capacity is expected to come from the United States. This will make the United States the third largest LNG exporter in the world, behind Australia and Qatar. Again, however, the United States has such a large domestic market and gas output that these exports will continue to constitute a relatively small share of its overall production.
Where has the additional US gas come from? As is the case in Australia, most of the additional gas produced in the United States has come from unconventional sources, from deposits that were long known to hold substantial reserves but which could not be exploited until technological innovation came along. In Australia’s case, the additional gas has been extracted from coal seams. In the US case, the additional resources are primarily shale gas that has been extracted via new horizontal drilling techniques and hydraulic fracturing (‘fracking’) in Pennsylvania and West Virginia (the so-called Marcellus area).

Structural enablers to the US gas revolution
The structure and size of the oil and gas industry are arguably more important than policy signals. Between 1970 and 2000, the United States produced around 19,000 PJ of natural gas per year, whereas Australia’s production totalled only a very small fraction of this over the same period. There is therefore a very good argument to be put that when gas prices rose in the early 2000s, the United States already had in place a strong, multi-tiered commercial oil and gas industry that was ready to invest in exploration, research and production when the market provided favourable price signals on the supply side.
Yet, there are undeniably key policy decisions that facilitated lower prices. In the first instance, in Pennsylvania and other areas where shale gas deposits exist, there have not been blanket bans or moratoria on exploration for — and the development and exploitation of — unconventional gas resources in the relevant areas. In addition to other important sources of comparative advantage such as resource quality, proximity to high density population centres and the productivity of the workforce, there are a number of other factors which have played important roles:
- Private property rights: In contrast to Australia and most other jurisdictions around the world where the state retains subsurface mineral rights, as a general rule in the United States, property owners have the right to extract natural gas that lies under the surface of their property. Of course, this also means that owners also have the right to reject proposals from developers. But this is exactly the point of well-defined, enforceable property rights to subsurface minerals and other resources: they reduce transaction costs31 and the possibility of the tragedy of the anticommons.32 This increases the likelihood that resources can flow to their most valuable uses (whether that means resource extraction or leaving resources in the ground). Where it is efficient for resource extraction to take place, the US property rights system increases incentives for development and resource exploitation, in the form of leasing and royalty arrangements and outright sales.
- Well-developed existing gas pipeline infrastructure and natural gas storage facilities: The United States has more than 210 separate existing natural gas pipeline systems, which together form a network of nearly 500,000 km of gas transmission. There are more than 11,000 delivery points, 1,400 interconnection points and 400 underground natural gas storage facilities. This vast existing infrastructure means that newly discovered gas can be rapidly transported to wherever it is needed. And storage facilities aid the efficient use of gas over time. There are around 30 gas transmission pipelines on the Australian east coast, with total length of around 20,000 km. There are eight storage facilities (not including storage in pipelines themselves). As a result of privatisation sales in the 1990s, the sector is fully privately owned.
- Pipeline regulation arrangements: Under a series of US federal deregulatory measures that occurred in the 1980s and 1990s, gas wellhead prices were deregulated and price ceilings were removed. Pipeline services were unbundled from gas sales, and an open access pipeline regime was introduced. Rate of return regulation for interstate pipeline pricing also came into effect.
- The United States’ relatively large fleet of Combined-Cycle Gas Turbine (CCGT) Generators: The United States has a newer and more efficient gas generation fleet, with a higher percentage of combined cycle gas turbines designed to run continuously as baseload generators. Since 2000, most of the additions to the US generation fleet have been CCGT plants, with CCGT capacity more than doubling over the period. CCGT now accounts for 23.6 per cent of overall generating capacity in the United States, compared to only 6.1 per cent in Australia. In contrast to open-cycle gas-turbines (OCGT), which are primarily used for peaking, CCGT is used as a baseload generation source. CCGT capacity factors have been increasing in the United States, and now match or exceed those of coal in many areas. CCGT is a relatively energy-efficient technology,33 with relatively short construction time and low construction costs compared with other baseload generation sources, wind and solar (measured on a dollar cost per unit of installed capacity basis).34 However, the relative economic attractiveness of CCGT [measured on a levelised cost (LCOE) basis] is sensitive to assumptions about fuel costs. For example, the Finkel Review, using data from AGL, argued that at a gas price of A$8/GJ, CCGT has a lower LCOE than firmed wind or solar, but that the ranking is reversed for a gas price of A$12/GJ.35
In summary, the key lesson for Australia from the US energy revolution is that resource abundance will only get it so far. Institutional arrangements, infrastructure development and regulatory and policy settings all matter for economic outcomes. In the case of energy, getting these things right means avoiding billions of dollars in additional costs for households and businesses, more jobs and investment, higher wages and lower emissions.
What can be done in Australia
So what is to be done? We defer detailed policy recommendations for future reports. Policy options to be analysed include:
- Ending moratoria on conventional and unconventional gas development, together with changing property rights regimes, or offering landowners a share in the gas income.
- Directly subsidising gas infrastructure expenditure (e.g., new pipelines, import terminals) or, at the very least, facilitating their development.
- Reforming the market architecture around gas pipelines and distribution networks, bringing them more into line with those in the United States.
- Introducing a formal national interest test for exports or some kind of formal domestic gas reservation policy.
- Reform of retention lease arrangements and the introduction of “use it or lose it” provisions, which restrict or cut off the ability of gas producers to renew or extend leases in the event that they have failed to exploit a gas field in a timely manner.
At the outset, we note that economists have identified a number of concerns with some of these options.
While there are clear benefits of gas development there are also environmental costs associated with unconventional gas exploitation, as seen in the Marcellus Basin around the US Northeast.36
There are clear disagreements about the cost and feasibility of major gas pipelines and import terminals in Australia. On import terminals, for example, Macquarie Research (2018) argue that “any import terminal will not lower prices on the east coast of Australia, and could potentially set a higher floor price”.
There is also debate on domestic reservation policies. Neill (2017) and Deloitte Access Economics (2013) argue that the costs of a domestic gas reservation policy are likely to outweigh the benefits, with Neill estimating that Western Australia’s domestic gas reservation policy (whereby the WA government requires 15 per cent of the output from new LNG developments to be supplied to the domestic market) has created an economic loss of between A$6.9 billion and A$22.9 billion in present value terms.
There are disagreements about the benefits and costs of “use it or lose it” arrangements. On the one hand, if gas producers are strategically taking advantage of existing rules to hold back production for the purpose of manipulating prices, then a “use it or lose it” provision may result in a more efficient utilisation of gas resources. On the other hand, if there are unforeseen delays in resource extraction or if development costs turn out to be higher than expected, then an arbitrary cut-off rule would increase project risk and reduce investment.
Some clear lessons learned on the pathway forward
The very clear lesson from the US experience is this: get the institutional and policy settings right, and the market will transform physical abundance into economic abundance, putting downward pressure on energy prices and emissions.
Unfortunately, over the past decade Australia has had almost the exact opposite experience — the mistakes or unintended consequences of policy have led to higher prices and weaker emissions reductions than the United States. If Australia’s energy policy settings do not change, many Australian firms will be forced to either scale back production, investment and employment, relocate to Australian states where energy is cheaper, move overseas, or simply shut down. There are no other options.
If Australia’s energy policy settings do not change, many Australian firms will be forced to either scale back production, investment and employment, relocate to Australian states where energy is cheaper, move overseas, or simply shut down. There are no other options.
Increased supply alone will not solve Australia’s energy crisis. Energy market architecture must also be addressed. The design of the National Energy Market — combined with a rapid uptake of renewables — has been a catalyst for recent increases in electricity prices. While renewables and storage capacity continue to grow and become less expensive, they still cannot provide the energy reliability required by industrial consumers of energy that other forms of electricity generation provide.
Amidst all of this, there is little policy certainty. Investors want fair, clear, stable and predictable rules. Without it, the investments required for bringing additional supply to market — of the magnitudes required by Australian industry — are unlikely to happen.
With technological improvements continuing to drive down the installation costs of (intermittent) wind and solar generators, it is far from obvious that Australia’s renewables sector still need the implicit subsidies that follow from renewable energy targets.
The US experience underscores the critical role of gas. The US shale revolution — combined with the policy settings and infrastructure facilitating it — has seen the trajectory of US energy prices flatten or turn down, for both homes and businesses. With gas now accounting for 33 per cent of America’s energy needs, the United States has already met its Paris Agreement emission reduction targets in the electricity sector. Natural gas is clearly the ‘bridge fuel’ toward a renewable future, while at the same time providing a less expensive and reliable source of energy for industrial users, and a vital input for many manufacturing processes.
With abundant physical reserves, Australia needs to consider policies that will unlock its gas resources, producing similar outcomes to those seen in the United States: cheaper energy, a manufacturing and industrial revival, job creation and economic growth, with a smaller emissions footprint.

